Major Swiss bank UBS agrees to buy Credit S; risk aversion may weaken【March 20, 2023】
Fundamental Analysis
U.S. Stock Indexes Fall, Selling Pressure on Banking Stocks Increases, Failing to Provide Support
Swiss Bank UBS Agrees to Government-Brokered Takeover of Credit Suisse
Worst Case Scenario of Global Crisis Averted as Credit S Fails
Some reports of a possible takeover of Silicon Valley Bank in the U.S.
Risk aversion may weaken slightly
Sensitive to other new financial and banking related materials
Japanese Yen, Gold and Bitcoin surged
Bitcoin soars from the bottom to hit USD 28,000
Gold near the USD 2,000 level and the US dollar is aware that the yen is below JPY 130
Market attention is on FOMC; wait-and-see attitude in the market just before the meeting
Crude oil prices fall, US economy worsening
Technical Analysis
The acquisition of Credit S, which had been a risk factor, is expected to trigger an adjustment in the oversold and overbought market. The dollar had been weakening, but profit-taking is likely to intensify. The U.S. FOMC meeting, a big event, is coming up this week, and market experts are divided in their views. A rate hike or a halt in rate hikes is expected to cause significant volatility. Position adjustment moves are expected to occur.
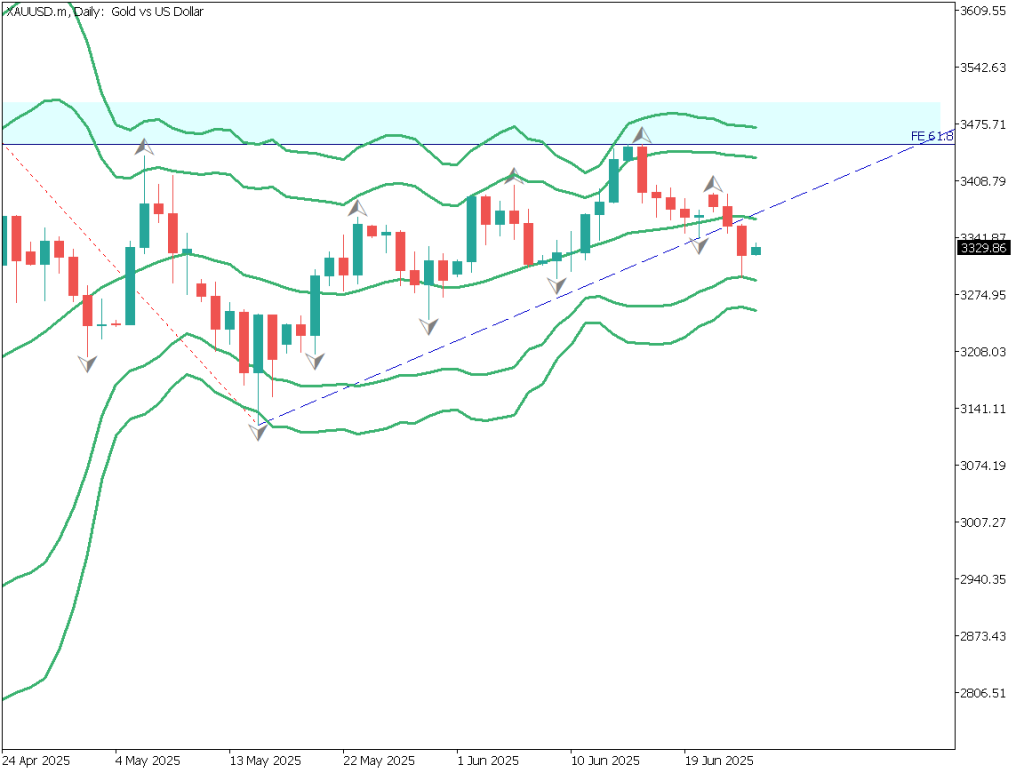
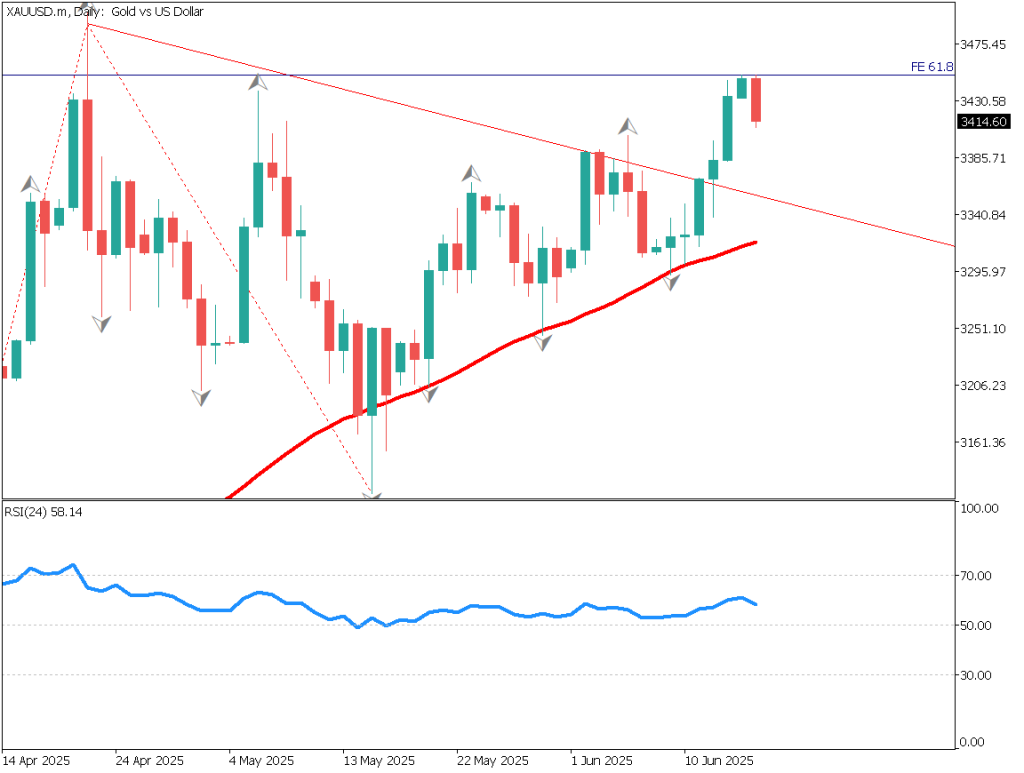
Gold (XAUUSD)
Analysis of the 4-hour chart of Gold shows the occurrence of a bandwalk, a key signal for Bollinger Bands. It occurs between +2σ and +3σ, suggesting a strong uptrend. News of concern may occur in other banks in the future, indicating an uptrend in the medium to long term.
However, the news of the Credit S takeover could push the price back down to USD 1950. The market is expected to change significantly depending on the U.S. FOMC’s response and Fed Chair Powell’s comments.
Estimated rangeUSD 1961.00 – USD 2007.00Resistance lineUSD 1996.00Support lineUSD 1972.00
Bitcoin (BTCUSD)
Bitcoin has entered the USD 28,000 level due to the weak dollar. The weekly chart shows that it has rebounded at the middle line of the Bollinger Band and is now at +2σ to +3σ. An adjustment reactionary move could occur this week or next week.
The RSI value is above 50, turning to a level indicating an upward trend for the first time in about a year. There is potential for a medium- to long-term move higher in the future. The immediate upside target is USD 28850.
Estimated rangeUSD 26720 – USD 29100Resistance lineUSD 28500Support lineUSD 27310
Dollar-Yen (USDJPY)
The dollar-yen may see a stronger adjustment. The worst is averted with the acquisition of Credit Suisse, which was the biggest risk factor. Profit-taking is likely. The 4-hour chart of USD/JPY shows that the RSI is gradually rising, suggesting a weakening of the downtrend.
As today is Multiple of 5 day, there is a high probability of a rally in the morning Tokyo session.
Estimated rangeJPY 130.48 – 133.27Resistance lineJPY 132.57Support lineJPY 131.80
Today’s Important Economic Indicators
Economic Indicators and EventsJST (Japan Standard Time)No important economic indicators–
*Trading advice in this article is not provided by Milton Markets, but by Shu Fujiyasu Jr., a certified technical analyst.
Risk Disclaimer
This analysis is for educational purposes only and does not constitute investment advice. Trading forex and CFDs involves significant risk and may not be suitable for all investors. Past performance is not indicative of future results.