Risk-On Move Sells Safe Assets; Markets Focus on FOMC【March 22, 2023】
Fundamental Analysis
U.S. Stock Indexes Rise on Risk-On
Treasury Secretary Yellen also hints at intervention in the banking system
FOMC meeting draws market attention; wait and see until the announcement
Risk appetite spurred by the lull in the Credit Suisse crisis
Gold and the yen will sell off as safe-haven assets
U.S. existing home sales beat expectations
U.K. Consumer Price Index due to be released, which will have a significant impact on policy rates
Dollar/Yen recovered to the JPY 132 level, possibly due to short-covering
Euro-Yen surges, Yen sell-off gains momentum
Technical Analysis
The overall currency market is buying the euro and selling the yen. Although there is a possibility of a rebound from last week, the risk-on movement yesterday led to a sharp rise in the U.S. and European stock markets and a buying trend in the euro. Selling of safe-haven assets such as gold and the Japanese yen prevailed, and gold plunged to the 1930s at one point. The FOMC meeting will be held today and the U.S. policy rate will be announced, making it difficult to hold long term positions until the FOMC meeting.
Euro/Yen (EURJPY)
Euroyen is above the 200 moving average at the close. It appears to be a short-covering move. If the yen continues to sell off today, the pair may recover to the JPY 144 level. On the other hand, the RSI is not above 50, and a scenario in which the pair falls back due to a lull should be taken into account.
Estimated rangeJPY 141 – JPY 144.02Resistance lineJPY 143.09Support lineJPY 141.45
US dollar/Yen (USDJPY)
The dollar recovered to the 132-yen level due to the yen sell-off. Volatility has been increasing recently, and the direction of the market has been unstable, changing from day to day. Today’s FOMC meeting is likely to determine the future direction to some extent. A rate hike would be a weight on stock prices, and there is an undeniable possibility that it would cause further financial-related turmoil, which could lead to risk-off.
Estimated rangeJPY 130.93 – 133.86Resistance lineJPY 133.50Support lineJPY 131.66
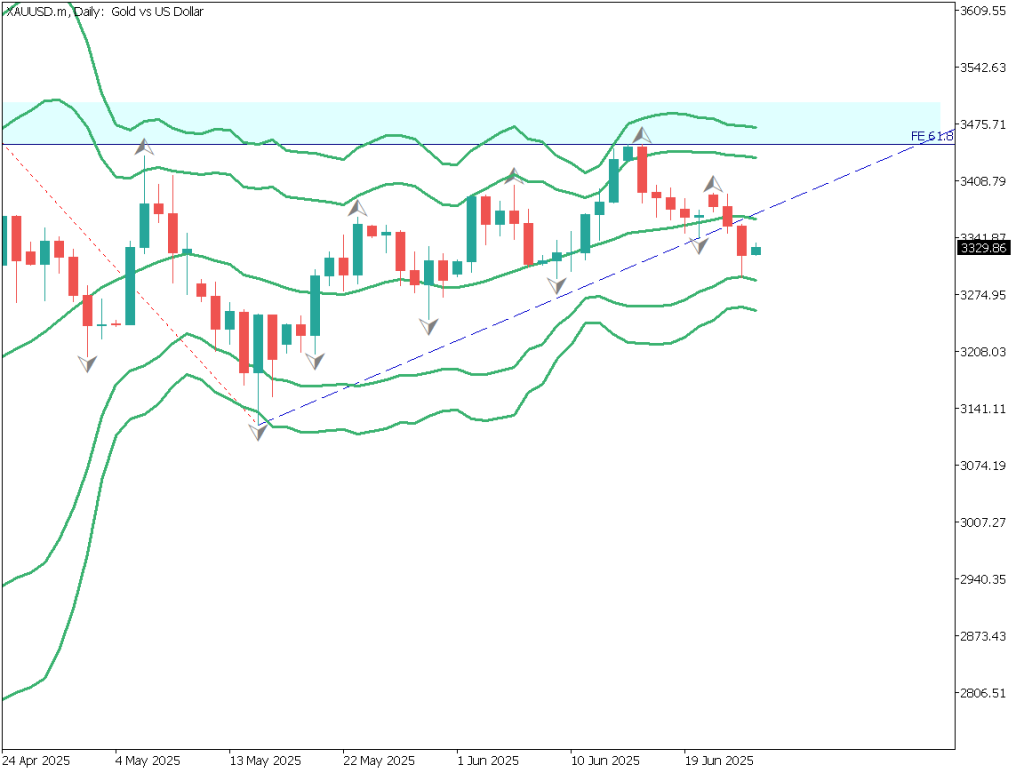
GOLD (XAUUSD)
Gold, a symbol of safe-haven asset, fell back at the USD 2,000 level; the RSI shows that it was sold off just as it approached 70, possibly due to profit-taking. On the other hand, looking at the daily chart, the daily price, which reached a recent high of USD 2009, was negative. The price had been rising sharply, and we should be aware of the possibility of a decline to the USD 1920 area.
Estimated rangeUSD 1920.00 – USD 1968.00Resistance lineUSD 1955.00Support lineUSD 1930.00
Today’s Important Economic Indicators
Economic Indicators and EventsJST (Japan Standard Time)U.K. Consumer Price Index16:00FOMC Policy Rate AnnouncementFRB Chairman’s Press Conference3:30 a.m. the next day
*Trading advice in this article is not provided by Milton Markets, but by Shu Fujiyasu Jr., a certified technical analyst.
Risk Disclaimer
This analysis is for educational purposes only and does not constitute investment advice. Trading forex and CFDs involves significant risk and may not be suitable for all investors. Past performance is not indicative of future results.