Exchange rates are risk-on; authorities consider further support measures for financial institutions【March 28, 2023】
Fundamental Analysis
Dow Jones Industrial Average and S&P 500 rise, risk on as financial worries ease
Nasdaq 100 falls, money flows out to financial stocks
U.S. regional bank stocks rise 2.5%, authorities reportedly considering additional support measures
Oil prices rise sharply, risk-on buying spreads
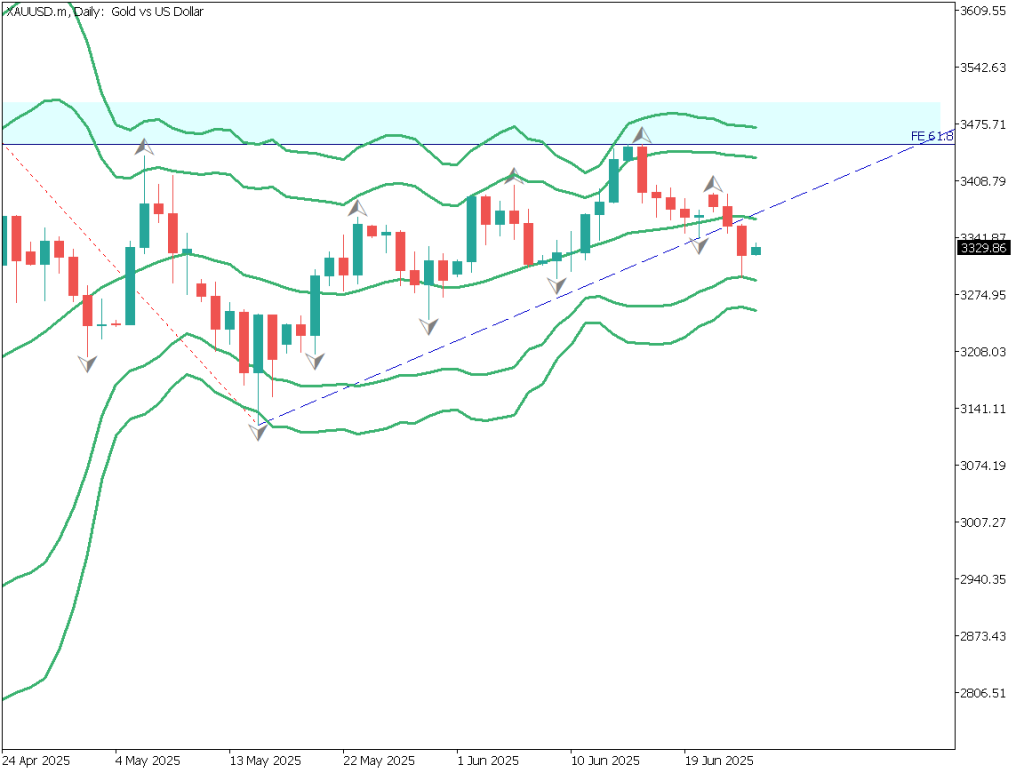
Gold, a safe-haven asset, falls, may fail to break the $2,000 level
Inverse yield between 10- and 2-year Treasuries remains, recession fears high
Banking turmoil subsides, but probability of economic downturn increases
Beware of temporary stock market rally; risk of yen strength remains
Technical Analysis
The overall currency market is clearly weakening against the dollar. The Japanese yen, a safe-haven asset, became the most easily sold currency, and the dollar continued to weaken. On the other hand, the Canadian dollar strengthened across the board due to the significant rise in crude oil prices.
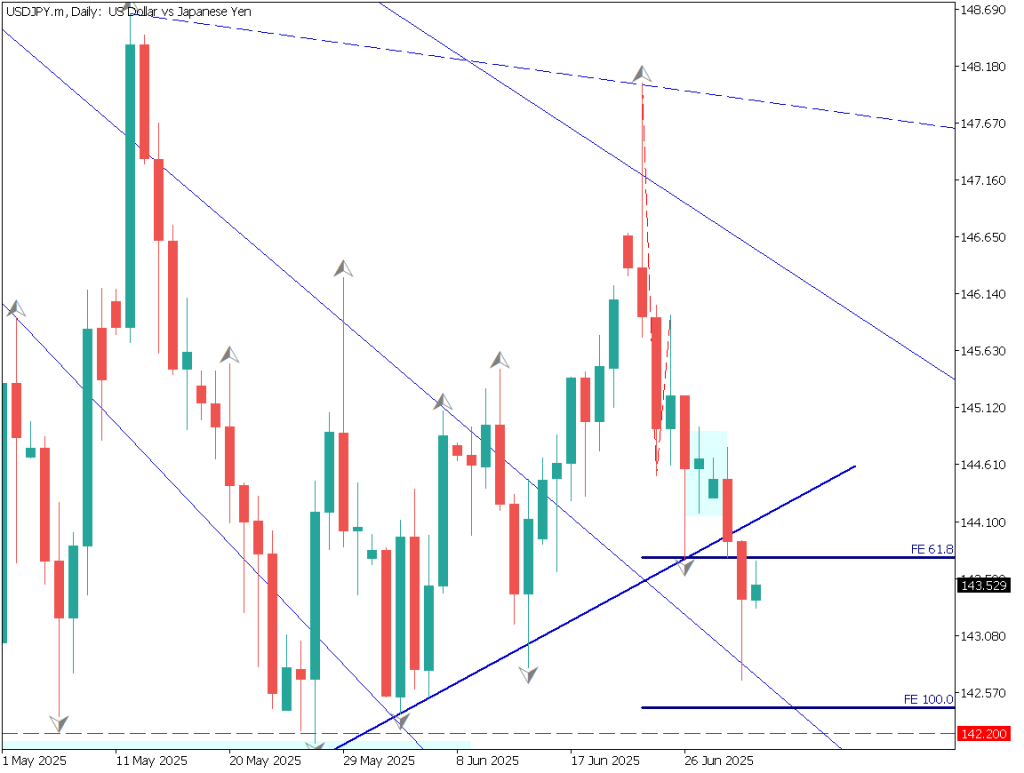
Dollar-Yen (USDJPY)
Analyzing the 4-hour chart of the USDJPY, a descending channel can be drawn. Currently, the pair is falling back at the upper band of the channel. Although the banking turmoil has calmed down, there are still concerns about a recession in the U.S., and it is difficult to imagine that the yen will remain weak forever. There is a probability that the yen will fall again, and a drop to the 130.60 area should be taken into account.
Estimated rangeJPY 130.57 – JPY 132.27Resistance lineJPY 131.80Support lineJPY 130.90
Canadian Dollar Yen (CADJPY)
The Canadian dollar strengthened across the board on the sharp rise in crude oil prices. On the other hand, risk-on awareness made it easier to sell the Japanese yen, and the Canadian dollar-yen rallied; the hourly chart shows that the pair is falling back at the 240 moving average (about 2 weeks).
We would consider the downside risk as the yen continues to be more easily bought overall.
Estimated rangeJPY 94.950 – JPY 96.950Resistance lineJPY 96.50Support lineJPY 95.60
Bitcoin
Analysis of the daily chart of Bitcoin shows the divergence in the RSI. The price had been soaring until last week, but there is a lull; we need to be wary of a major selloff, as divergence in the RSI is one of the signals that indicate a market turnaround.
A drop to around USD 27,360 should be taken into account.
Estimated rangeUSD 25690 – USD 28420Resistance lineUSD 27720Support lineUSD 26730
Today’s Important Economic Indicators
Economic Indicators and EventsJST (Japan Standard Time)Bank of England Governor’s Parliamentary Testimony17:45Richmond Fed Manufacturing Index23:00
*Trading advice in this article is not provided by Milton Markets, but by Shu Fujiyasu Jr., a certified technical analyst.
Risk Disclaimer
This analysis is for educational purposes only and does not constitute investment advice. Trading forex and CFDs involves significant risk and may not be suitable for all investors. Past performance is not indicative of future results.