U.S. employment data exceeded expectations, raising speculation of additional rate hikes at the next U.S. FOMC meeting【April 10, 2023】
Fundamental Analysis
U.S. employment data exceeds market expectations
Probability of 0.25% rate hike increases at May US FOMC meeting
Weak ADP jobs report and unemployment insurance numbers
U.S. monetary officials deny any change in the path of interest rate cuts
Gold temporarily falls to USD 2,000
BOJ Governor Kuroda Steps Down, Says Prices Closer to Target
U.S. Bank Loan Amounts Sharply Decline, High Interest Rates Affecting U.S. Economy
Technical Analysis
The release of the U.S. jobs report strengthened the dollar overall and the dollar rose against the yen. The stronger dollar also put selling pressure on gold, which remained at a higher level. Despite the continued high interest rate conditions, we believe that additional rate hikes may be inevitable as the employment situation remains strong and inflation remains high.
In addition, the Swiss franc is likely to be bid up after the Credit Suisse acquisition has taken a step back. With Oceania and Europe being holidays, there are fewer market participants. Unexpected market movements should be watched carefully.
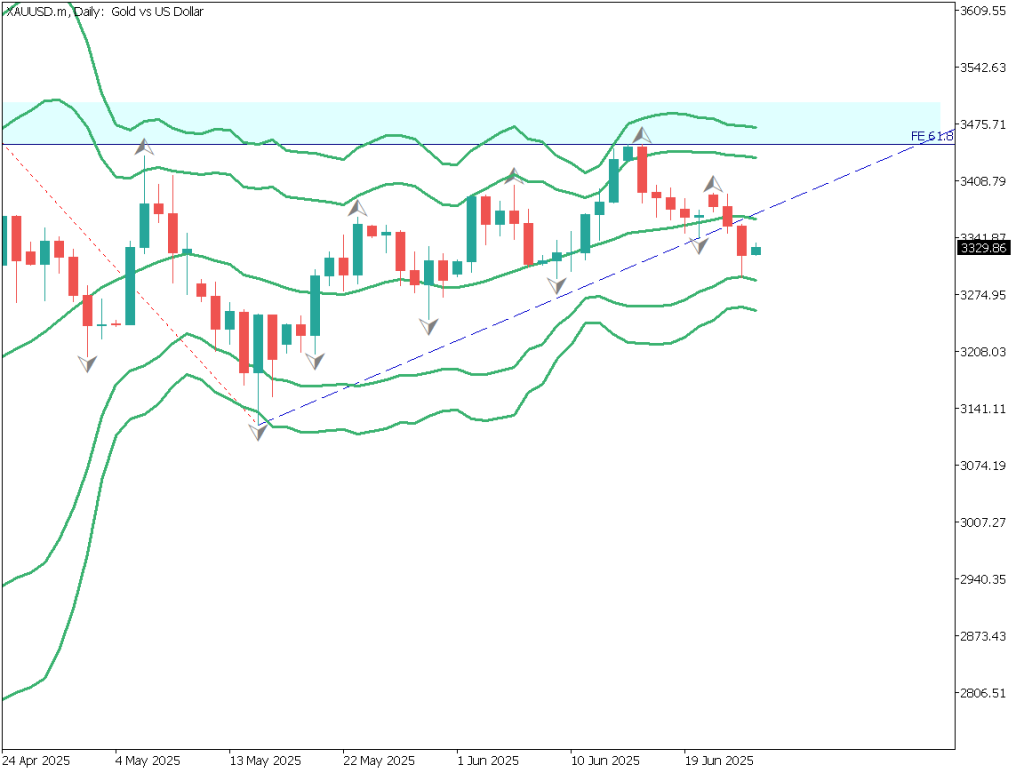
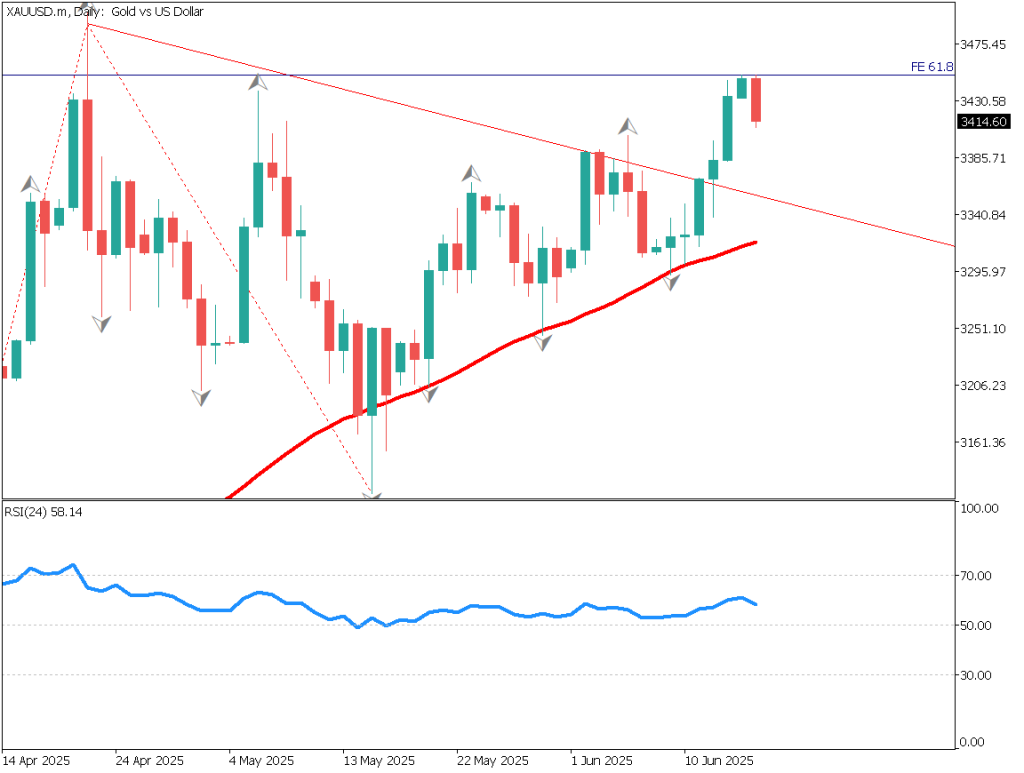
GOLD (XAUUSD)
Analyzing the daily chart of Gold, a crosshair appears at a high level. It also has a “positive + crosshairs + negative” line, which resembles the shape of the “Evening Star”. We expect the round number of USD 2,000 to be considered as a support line and USD 2,000 as a resistance line.
If the dollar continues to strengthen, the price may fall sharply after breaking below the USD 2,000 level.
Estimated rangeUSD 1975 – USD 2039Resistance lineUSD 2020Support lineUSD 2000
Dollar-Yen (USDJPY)
Short-term analysis on the hourly chart of the dollar-yen. The dollar rebounded at the JPY 130 level, and then moved to the JPY 132 level after the better-than-expected employment data. JPY 132.30 is a point that has been recognized in past markets. JPY 133.45 is the next target value if the price clearly crosses 132.30. The dollar has no direction on the daily time frame.
The daily chart shows no sense of direction, with the highs falling and the lows rising, and there is a possibility that a major trend will eventually be triggered by something.
Estimated rangeJPY130.72 – JPY 133.66Resistance lineJPY 133.45Support lineJPY 130.43
Australian dollar / Swiss franc (AUDCHF)
Analyzing the currency strength, the AUD is weakening against the AUD and the CHF is strengthening against the CHF, and analyzing the daily chart of the AUDCHF, the pair has made a slight recent low. A downtrend based on the Dow Theory is in place. We expect the target price range to be in the CHF 0.5970 range.
Estimated rangeCHF 0.5961 – CHF 0.6093Resistance lineCHF 0.6070Support lineCHF 0.5977
Today’s Important Economic Indicators
Economic Indicators and EventsJST (Japan Standard Time)Holidays in Oceania and Europe–
*Trading advice in this article is not provided by Milton Markets, but by Shu Fujiyasu Jr., a certified technical analyst.
Risk Disclaimer
This analysis is for educational purposes only and does not constitute investment advice. Trading forex and CFDs involves significant risk and may not be suitable for all investors. Past performance is not indicative of future results.