Adjustment market as dollar strength pauses; focus on European consumer price index【April 19, 2023】
Fundamental Analysis
Major U.S. stock indexes are in a state of sell-off, with no clear sense of direction
U.S. financial officials said they support higher interest rates for a considerable period of time after the rate hike
Will U.S. financial institutions hold back on lending, restraining demand in the future?
Is this a message that interest rates will not be cut immediately?
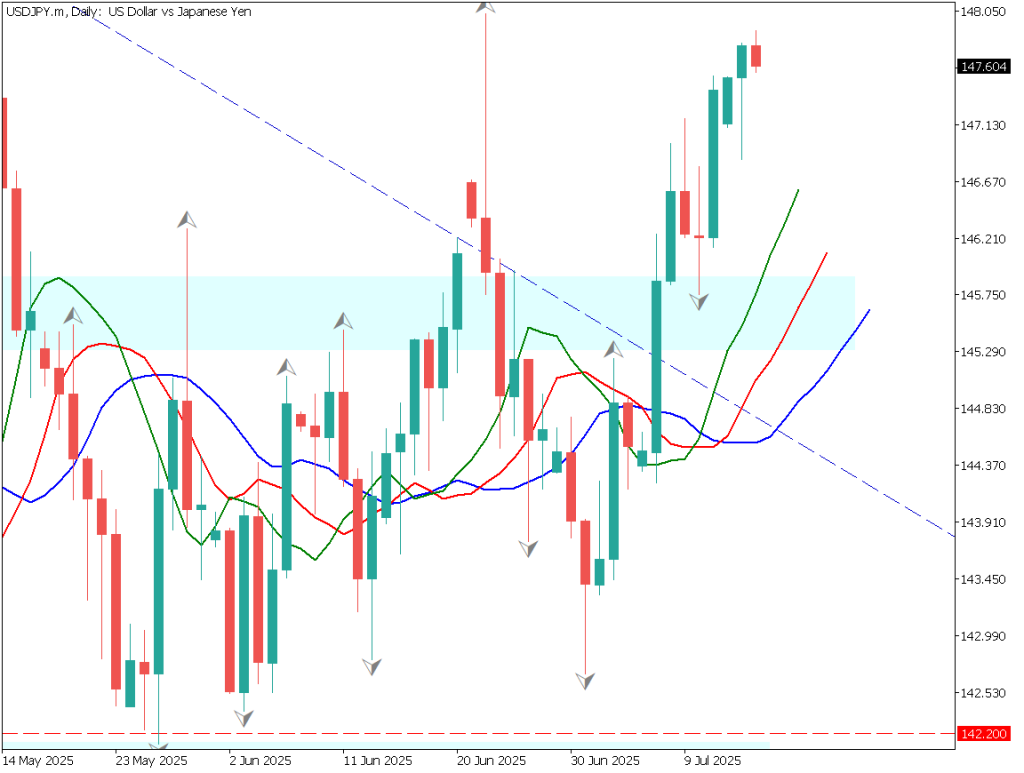
USDJPY range narrows ahead of BOJ meeting
Canadian CPI below expectations, inflation slowing, but Bank of Canada governor remains cautious
German Economic Indicators Fall Short of Estimates, Raising Possibility of Economic Deterioration
Technical Analysis
The dollar’s appreciation has paused in the overall exchange market, and the market is now in an adjustment phase. Today, the consumer price index for the U.K. and the EU is scheduled to be released, and depending on the results, the market is expected to move significantly, so caution is needed around the time of the release.
Analysis of currency strength/weakness shows no clear sense of direction for any of the currencies. Therefore, at the time of writing, the currency pairs are likely to move sideways.
Pound Sterling Dollar (GBPUSD)
Analyze the 4-hour chart of the pound dollar. The pair was rising steadily along the uptrend line, but after breaking out to the downside, we can see that the uptrend line has turned into a resistance line.
On the other hand, a double top has formed and the neckline at USD 1.2350 is acting as a support band. The pair is sandwiched between the top and bottom, and there is no sense of direction at this stage. The focus will be on the consumer price index and key figures’ statements.
Estimated rangeUSD 1.2332 – USD 1.2516Resistance lineUSD 1.2470Support lineUSD 1.2374
Bitcoin (BTCUSD)
The bitcoin market, however, is maintaining the USD 30,000 level. Drawing the Fibonacci Expansion, the price has broken out of the resistance zone at USD 28,600, which has been under attack for 20 days, and is rising. Although a U.S. interest rate hike is a certainty and selling pressure will intensify, we believe that the probability of a long-term rise is high. Our price target for the next few months is 161.8% at USD 34,100, but our near-term target is USD 31,800.
Estimated rangeUSD 29,170 – USD 31,400Resistance lineUSD 31,000Support lineUSD 29,780
Nikkei Stock Average (NIKKEI225)
Analyze the 4-hour chart of the Nikkei Stock Average. The Nikkei Stock Average has been relatively steady. It seems that Warren Buffett’s reported purchase of Japanese trading company stocks is attracting attention. Wage hikes are also in the works, and domestic demand is considered to be recovering well. While the rest of the world is moving toward higher interest rates, the Bank of Japan is maintaining a low interest rate policy, which seems to be making Japanese stocks more attractive.
Technically, after rebounding at the moving average, the 61.8% Fibonacci Expansion can be seen in the consciousness of the market. 100% of this Fibonacci Expansion would be JPY 29,300.
Estimated rangeJPY 28,290 – JPY 28,950Resistance lineJPY 28,800Support lineJPY 28,460
Today’s Important Economic Indicators
Economic Indicators and EventsJST (Japan Standard Time)U.K. Consumer Price Index15:00Eurozone Consumer Price Index18:00
*Trading advice in this article is not provided by Milton Markets, but by Shu Fujiyasu Jr., a certified technical analyst.
Risk Disclaimer
This analysis is for educational purposes only and does not constitute investment advice. Trading forex and CFDs involves significant risk and may not be suitable for all investors. Past performance is not indicative of future results.