Gold Falls, Eyes on U.S. Consumer Price Index【January 11, 2024】
Fundamental Analysis
U.S. Consumer Price Index scheduled for release today
Inflation slowdown could pressure gold prices down
ECB officials comment against expectations of early rate cuts
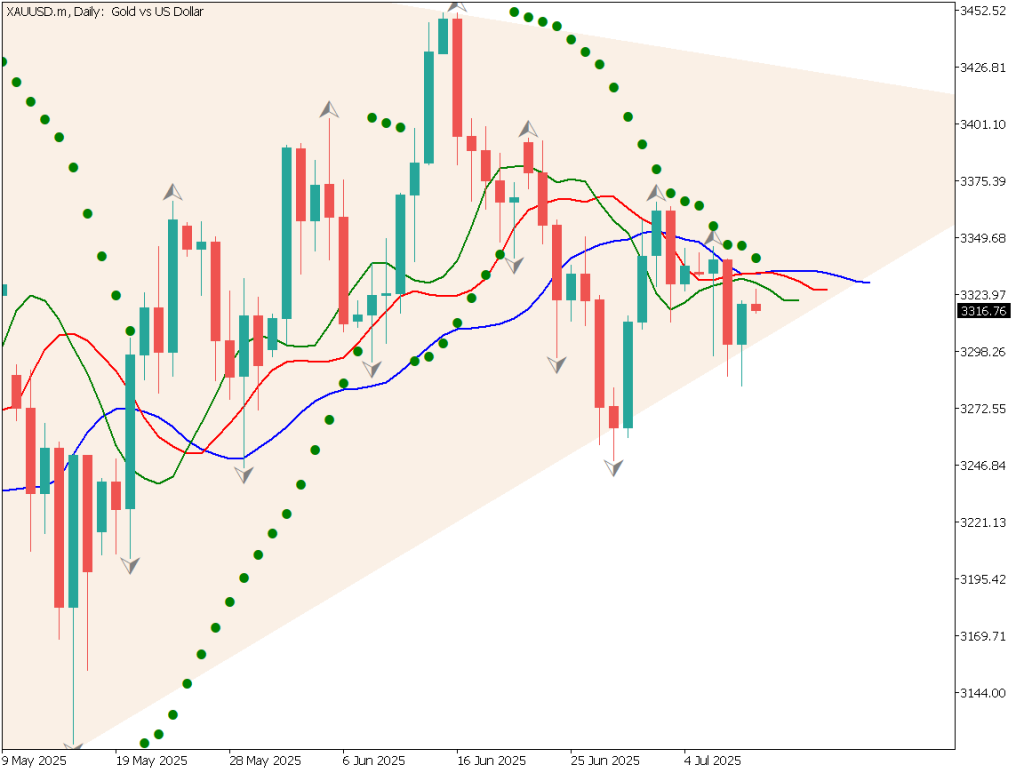
XAUUSD Technical Analysis
Analyzing the daily chart of gold prices. Gold has broken below the rising channel, with USD 2,016 as a key support line. USD 2,006 to USD 2,016 could act as a strong support zone.The 240-day moving average is flat, not indicating a strong uptrend. The RSI is at 50.9, with the crucial point being whether it drops below 50. A drop below 50 could increase downward pressure on gold, potentially leading to a fall near USD 2,000.Today’s U.S. CPI is a market focal point, with the progress of U.S. inflation slowdown or disinflation likely impacting gold trends.
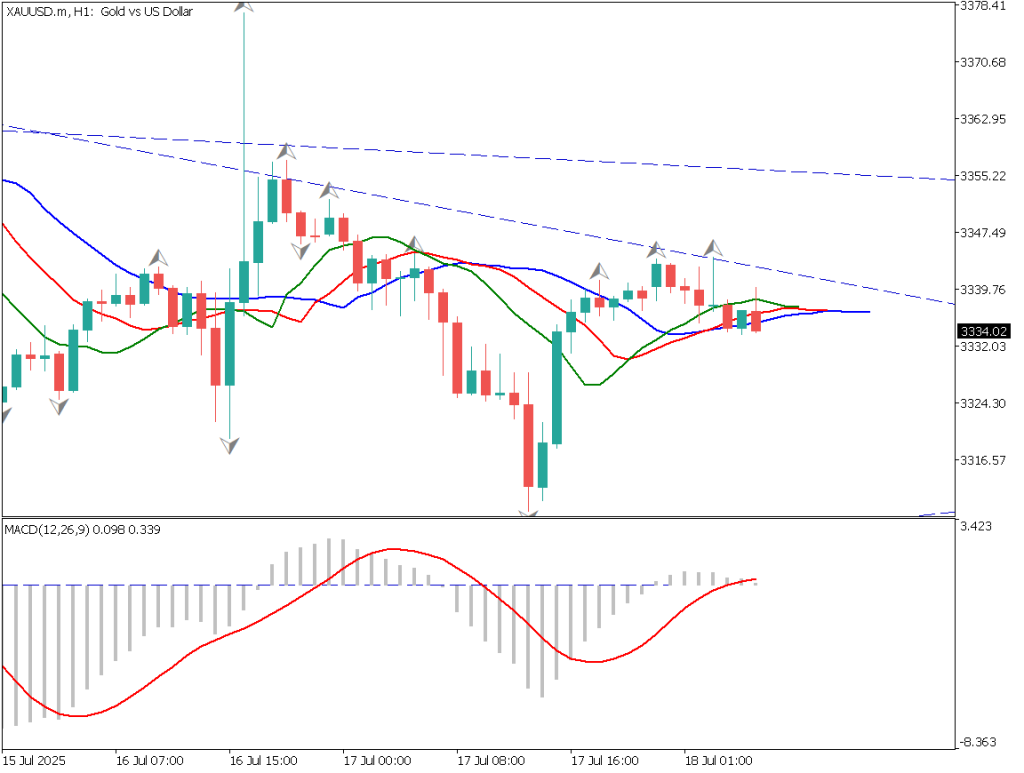
Day Trading Strategy (1-Hour Chart)
Analyzing the 1-hour chart of gold prices. Currently, two descending trend lines can be drawn, possibly forming a double bottom with higher lows.If U.S. CPI results confirm inflation slowdown, the support line at USD 2,016 might break. Range trading expected until the CPI announcement.Day traders should wait and see until the U.S. CPI release. If inflation slowdown is clear and gold trends downward, consider following the trend. In this case, the first downside target is USD 2,006, followed by USD 2,000.
Support and Resistance Lines
Upcoming significant support and resistance lines:
USD 2,016: Weekly support lineUSD 2,006: Monthly support line
Market Sentiment
XAUUSD: Sell: 52%, Buy: 48%
Today’s Important Economic Indicators
Economic Indicators and EventsJST (Japan Standard Time)ECB Economic Report18:00U.S. Core Consumer Price Index22:30
*Trading advice in this article is not provided by Milton Markets, but by Shu Fujiyasu Jr., a certified technical analyst.
Risk Disclaimer
This analysis is for educational purposes only and does not constitute investment advice. Trading forex and CFDs involves significant risk and may not be suitable for all investors. Past performance is not indicative of future results.