USDJPY Rises as U.S. Jobless Claims Decrease【August 9, 2024】
Fundamental Analysis
The RBA Governor Comments on Unwillingness to Hike Rates; AUD Surges
USDJPY Rises to 147.80 JPY, with the 10-Day Moving Average Acting as Resistance
USDJPY technical analysis
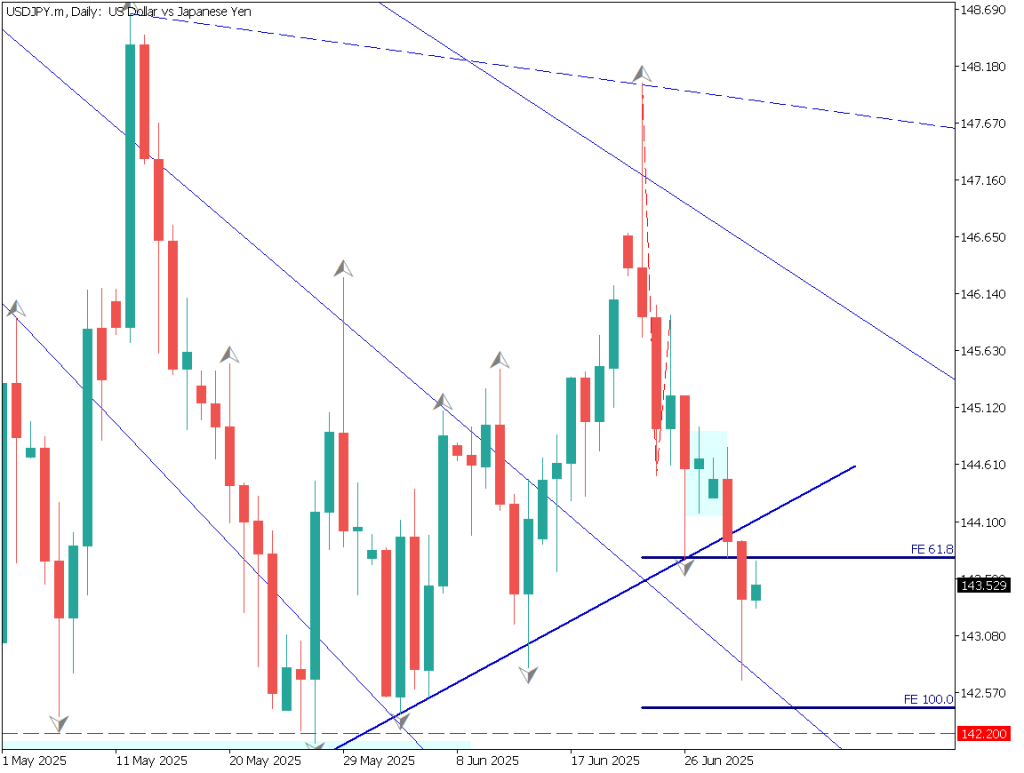
Analyzing the USDJPY daily chart, USDJPY has risen from the 141 JPY level to 147.80 JPY, with a 500-pip drop and a 600-pip rise just this week. The market exhibits extremely high volatility and is highly unstable. When a strong trend is present, the 10-day moving average serves as a reference.
Whether USDJPY can break above the 10-day moving average will be one factor in determining whether this is a temporary rebound or a signal of bottoming out and rising. Although the Bank of Japan stated that it would not raise rates in the current unstable environment, there is still a possibility of a rate hike if the market stabilizes.
The yen’s appreciation trend has not reversed.
Day trading strategy (1 hour)
Analyzing the USDJPY 1-hour chart, the 10-day moving average and the 200-day moving average are forming a golden cross. However, it is still unclear whether this is a temporary rise or a signal for an uptrend, as the 200-day moving average is not flat but trending downward.
The upper target is expected to be around 148.75 JPY. Although a temporary rise may occur, there is a high possibility of a pullback.
Entry: 148.75 JPY, Exit: Around 147 JPY where the 200-day moving average is located, Stop: 149.50 JPY.
Support/Resistance lines
Here are the support and resistance levels to consider going forward:
147.56 JPY – 10-day moving average
Market Sentiment
USDJPY Short: 47% Long: 53%
Featured Currency Pair of the Week (AUDNZD)
AUDNZD surged. The RBA Governor’s comments on willingness to hike rates led to AUD buying. As the RBNZ leans towards a rate cut, the market reacted straightforwardly to policy rate expectations. The pair is trading above the 10-day moving average, and the chart suggests further upward momentum. Attention should be paid to the fact that it has surpassed the 50% Fibonacci retracement level. The upper target is predicted to be 1.099 USD, corresponding to the 61.8% retracement.
Today’s important economic indicators
Economic indicators and eventsJapan timeGerman Consumer Price Index15:00Canadian Employment Statistics21:30
*Trading advice in this article is not provided by Milton Markets, but by Shu Fujiyasu Jr., a certified technical analyst.
Risk Disclaimer
This analysis is for educational purposes only and does not constitute investment advice. Trading forex and CFDs involves significant risk and may not be suitable for all investors. Past performance is not indicative of future results.


