Fundamental Analysis
- [object Object]
- [object Object]
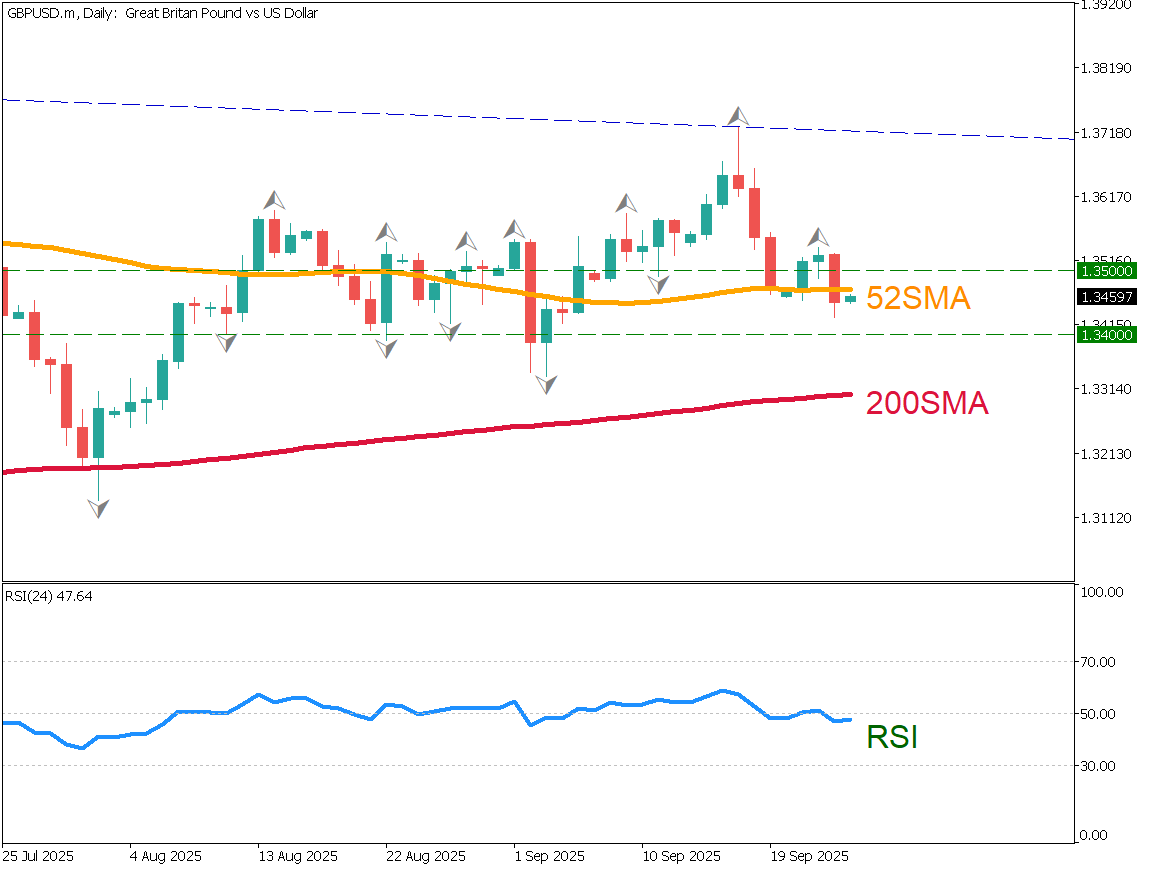
GBPUSD closed below the 52-day SMA
GBP/USD posted a relatively large bearish candle, falling to around 1.3425. This move represents a typical “sell on rally” pattern, and the downtrend is becoming more evident. A key technical point from yesterday is that the price closed below the 52-day moving average. It is also noteworthy that a fractal appeared near the recent rebound high.
Although the 1.34 support level has not been broken, lower highs indicate growing selling pressure. The UK is likely to continue rate cuts, while the Fed remains cautious, monitoring tariff effects. As currencies with stronger rate-cut expectations tend to be sold more easily, GBP/USD is expected to face increasing downward pressure.
The next important support levels are at 1.34 and the 200-day moving average.
Day Trading Strategy
Today, the basic approach should be to sell on rallies.
Since the pair dropped sharply yesterday, some rebound is expected. A good entry for short positions may be around 1.3470, which aligns with the 52-day moving average on the daily chart.
On the 15-minute chart, the 50% Fibonacci retracement is near 1.3480.
Therefore, selling opportunities may arise in the 1.3460–1.3480 zone.
Key Economic Events Today
Time
Bank of Japan Monetary Policy Meeting Minutes
8:30
US-GDP
21:30
Risk Disclaimer
This analysis is for educational purposes only and does not constitute investment advice. Trading forex and CFDs involves significant risk and may not be suitable for all investors. Past performance is not indicative of future results.


