Market Remains Quiet During Golden Week, USDJPY Moves Sideways【April 30, 2025】
Fundamental Analysis
President Trump signed an executive order to reduce the burden of automobile tariffs.
The second round of Japan–U.S. negotiations is scheduled for this week.
USDJPY Technical Analysis
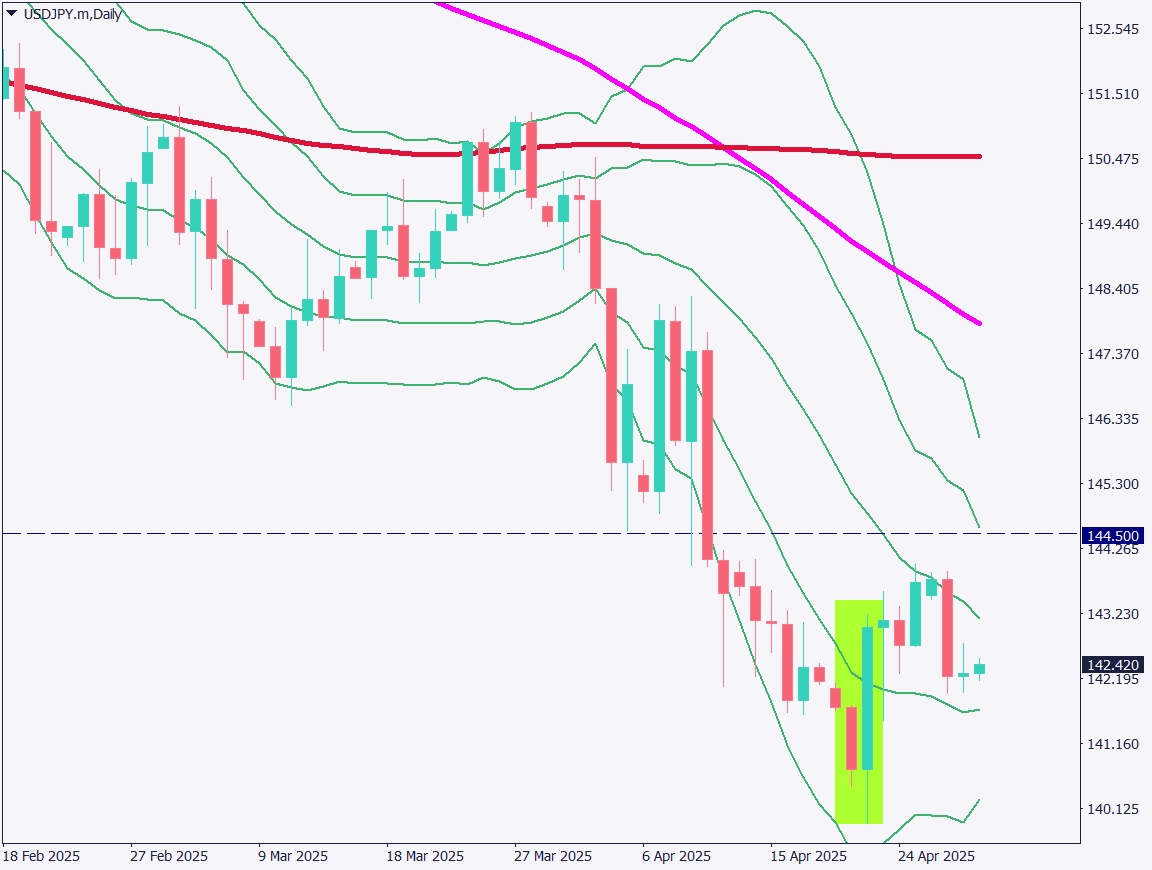
Analyzing the daily chart of USDJPY:
USDJPY is hovering around 142.42JPY. An engulfing candlestick pattern has appeared near the recent lows, which would normally suggest a potential market reversal. However, with the U.S. Dollar Index declining and the market tilted toward USD selling, it may take more time before a clear trend reversal is confirmed.
The price is currently facing resistance near the middle band of the Bollinger Bands. The 144JPY–144.50JPY range is a strong resistance zone with high selling pressure. Although large movements are uncertain during Golden Week, caution is advised.
Day trading strategy (1 hour)
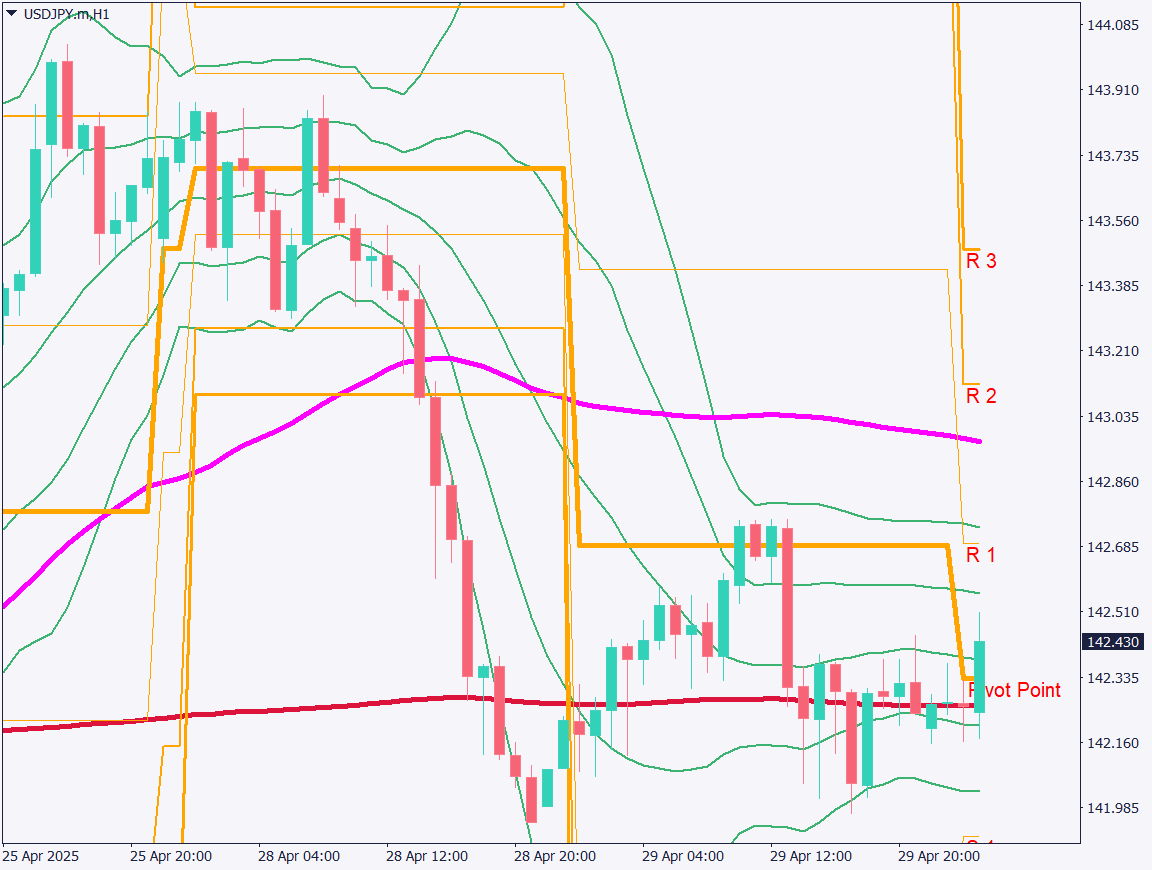
Analyzing the 1-hour chart of USDJPY:
The price has been stagnating around the 200-period moving average, but there are signs of a slight rebound. The pivot point is around 142.30JPY, and at the time of writing, a rebound trend is observed.
As it is Golden Week, no significant movement is expected in the Tokyo session. The area around 142.65JPY, corresponding to R1, is expected to act as a resistance level.
Today’s strategy is range trading.
Assume a range between 142.30JPY and 142.65JPY—buy near the lower bound, and sell near the upper bound. If the range is clearly broken, consider stopping the trade.
Support/Resistance lines
Key support and resistance lines to consider:
142.65JPY – Pivot R1
142.30JPY – 200-period Moving Average
Market Sentiment
USDJPY Sell: 41% / Buy: 59%
Today’s important economic indicators
Economic Indicators and EventsJapan TimeRetail Sales8:50Australian CPI10:30German GDP17:00Eurozone GDP18:00U.S. ADP Employment Report21:15U.S. GDP21:30Canadian GDP21:30U.S. Core PCE Price Index23:00
*Trading advice in this article is not provided by Milton Markets, but by Shu Fujiyasu Jr., a certified technical analyst.
Risk Disclaimer
This analysis is for educational purposes only and does not constitute investment advice. Trading forex and CFDs involves significant risk and may not be suitable for all investors. Past performance is not indicative of future results.