Gold Forming a Triangle Pattern – Watch for Breakout【June 11, 2025】
Fundamental Analysis
U.S. CPI to Be Released Today
Gold is currently supported by the 52-day moving average.
XAUUSD Technical Analysis
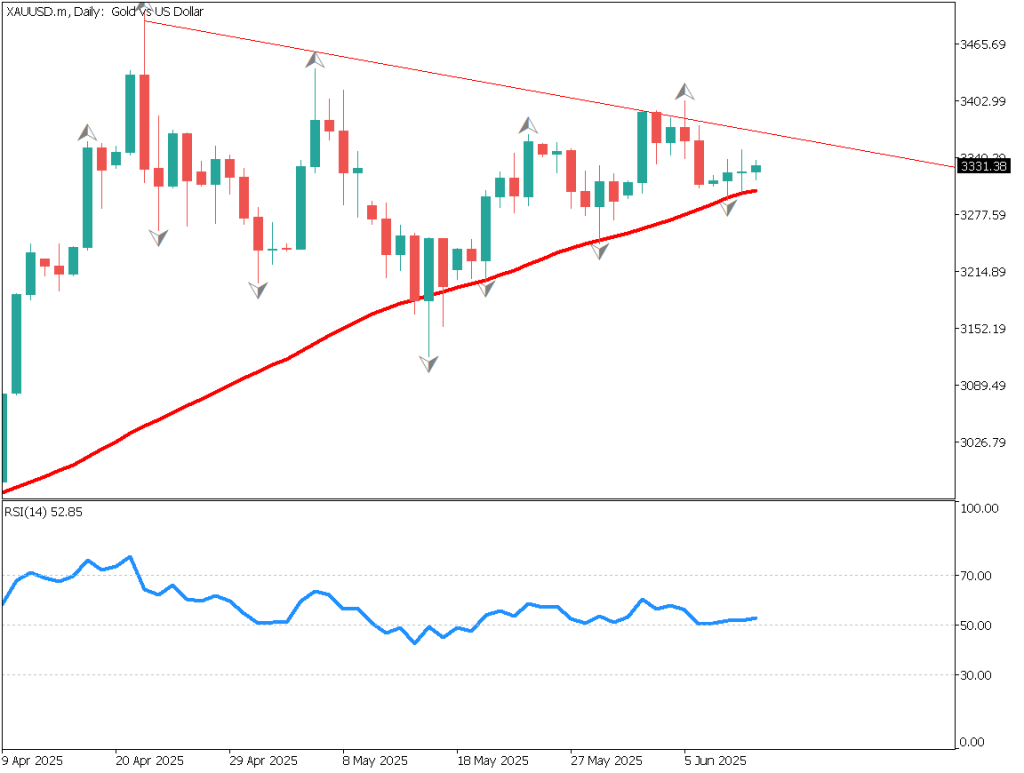
Analyzing the daily chart of gold, we can observe a triangle pattern with descending highs and ascending lows. The 52-day moving average is acting as support for the lows. Fractals are appearing evenly above and below the price, and the range is narrowing.
Gold is currently trading around 3,330USD, and a breakout could occur at any time. The longer the range-bound market continues, the stronger the energy behind the eventual breakout.
Today, the U.S. CPI will be released. If the figure comes in higher than expected, the Federal Reserve may become more cautious about rate cuts. The U.S. President is advocating for rate cuts, so tensions may rise. Be alert for sudden remarks from the President.
XAUUSD/Daily
Day Trading Strategy (1-Hour Chart)
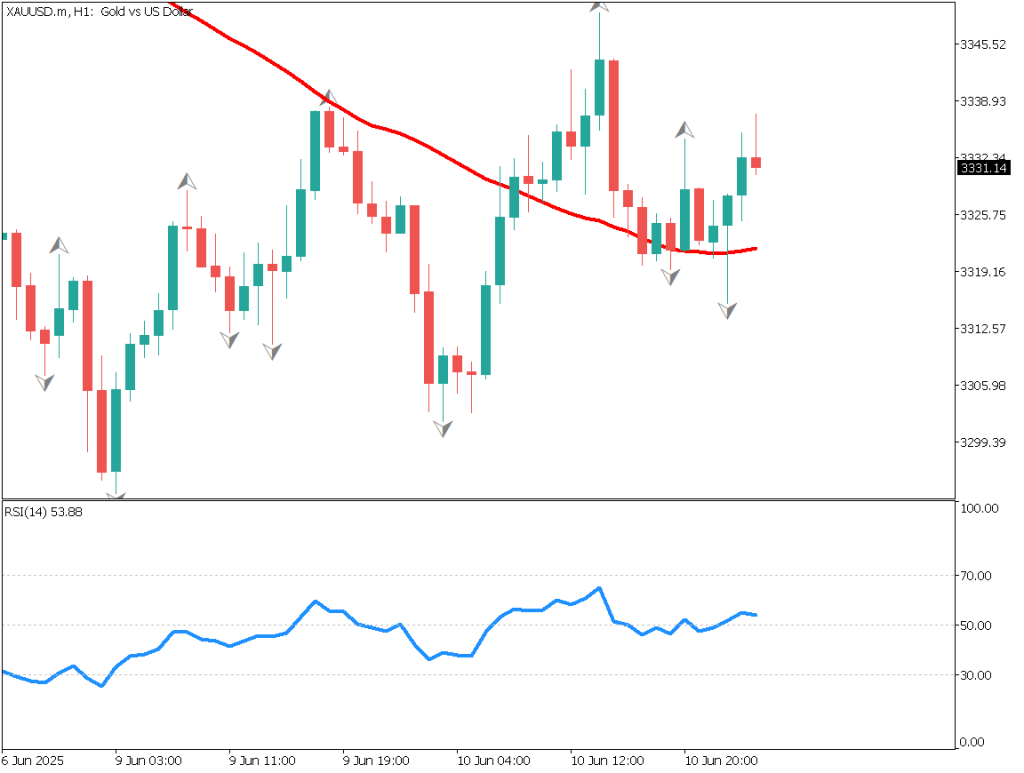
On the 1-hour chart, the 52-period moving average appears to be supporting the candlesticks. The 3,300 USD area is proving to be strong support, with price wicks appearing—indicating buying on dips.
Lows are rising on the 1-hour chart, and the RSI is above 50. There’s a slight bullish bias in this phase.
Depending on the outcome of the U.S. CPI, we favor a buy-on-dip strategy, with a stop below 3,300 USD. If a breakout occurs, gold may rise to around 3,400 USD.
XAUUSD/1H
Support and Resistance Levels
Support and resistance levels to watch going forward:
3,365 USD– Downtrend line
3,300 USD – 52-day moving average
Market Sentiment
XAUUSD
- 53% short / 47% long
Key Economic Events Today
Time (JST)*Event21:30*U.S. Consumer Price Index (CPI)
*Trading advice in this article is not provided by Milton Markets, but by Shu Fujiyasu Jr., a certified technical analyst.
Risk Disclaimer
This analysis is for educational purposes only and does not constitute investment advice. Trading forex and CFDs involves significant risk and may not be suitable for all investors. Past performance is not indicative of future results.