USD/JPY Maintains Bearish Trend, Breaks Below 52-day Moving Average 【June 27, 2025】
Fundamental Analysis
The US dollar weakened following reports of President Trump’s intent for an early appointment of a new Fed Chair.
Several Federal Reserve board members signaled potential rate cuts, intensifying USD selling pressure.
USDJPY Technical Analysis
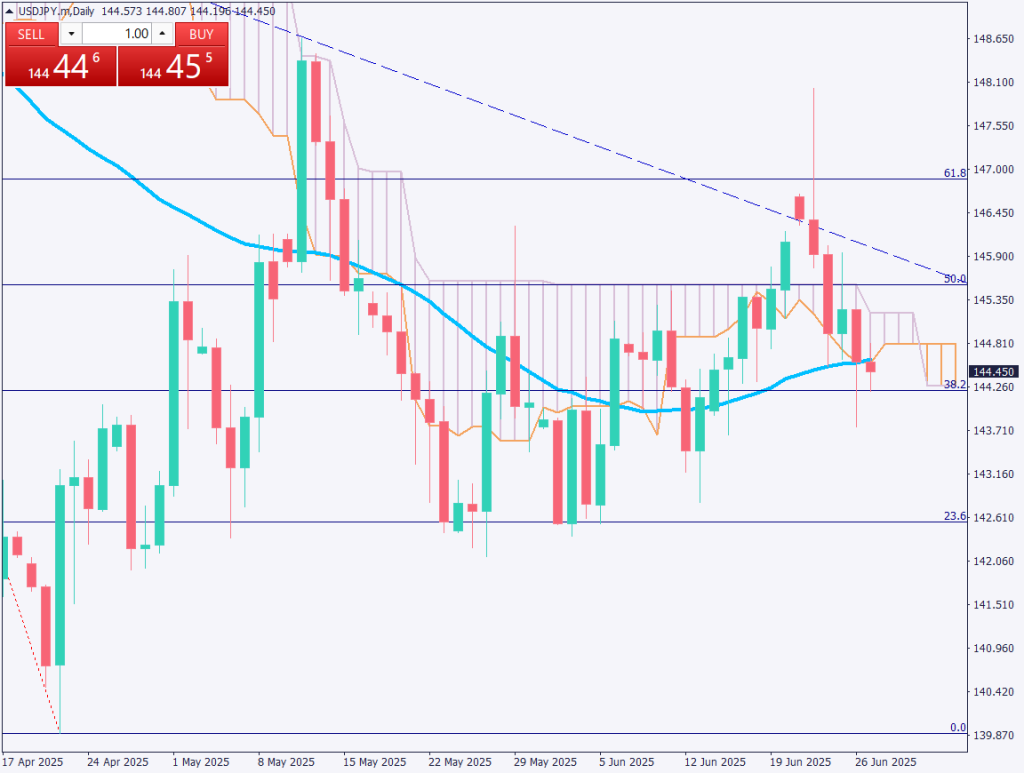
Analyzing the daily chart of USD/JPY, the pair broke below the 52-day moving average, dropping to the 38.2% Fibonacci retracement level.
Fibonacci levels continue to hold strong technical influence, resulting in ongoing narrow-range trading. The current support level is around 144.26 yen, but intensified USD selling could push prices towards the 23.6% Fibonacci level near 142.60 yen. Historically, the 142.60 yen mark has provided robust support, bouncing back prices six times previously.
While uncertainty remains around the continuation of dollar selling, breaking the 52-day moving average significantly increases the likelihood of further declines toward the 142-yen level. A bearish trading bias is preferred.
USDJPY/Daily
Day Trading Strategy (1-Hour Chart)
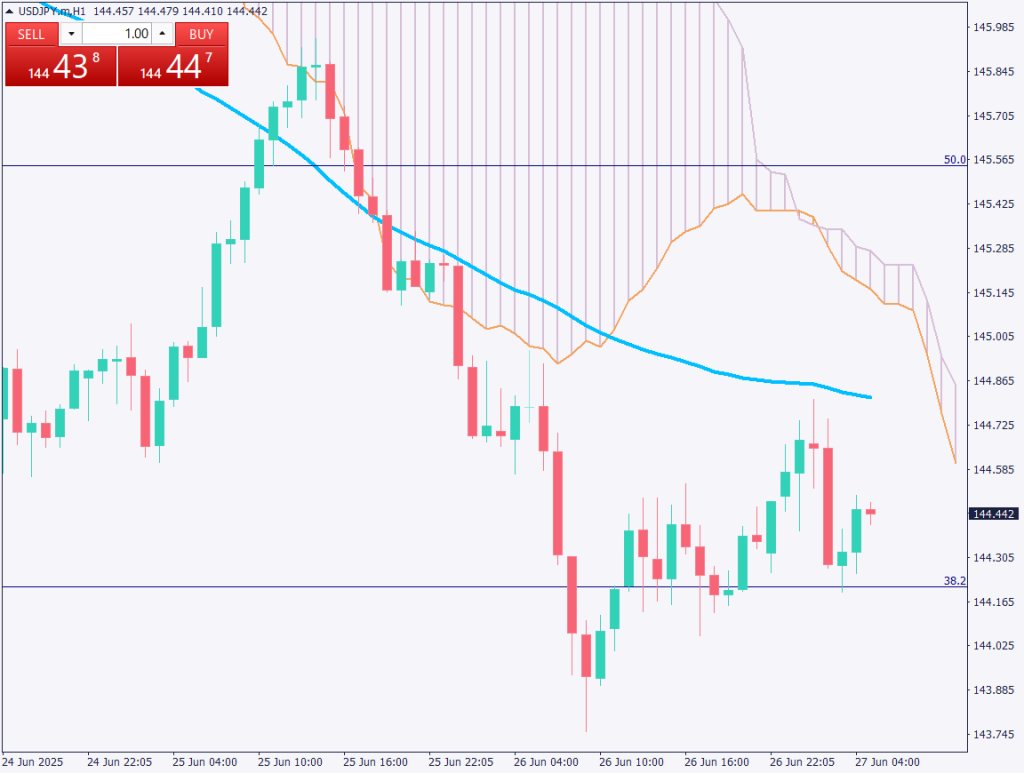
On the hourly chart, recent price action shows slightly rising lows over the short term. Traders should remain cautious until a clear break below the 38.2% Fibonacci level occurs. A confirmed break of this level is likely to trigger stop-loss selling, potentially sending prices towards the 142-yen area.
Recommended day trading strategy:
Sell Limit around 144.70 yen
Stop Loss at 144.85 yen
Take Profit at around 142.65 yen
USDJPY/1H
Support and Resistance Levels
Support and resistance levels to watch going forward:
- 142.65 yen: Previously significant support level
Market Sentiment
USDJPY
- 38% short / 62% long
Key Economic Events Today
*Event/Indicator***Time(JPT)**UK Gross Domestic Product (GDP)15:00Canada Gross Domestic Product (GDP)21:30US Personal Consumption Expenditure (PCE)21:30
Risk Disclaimer
This analysis is for educational purposes only and does not constitute investment advice. Trading forex and CFDs involves significant risk and may not be suitable for all investors. Past performance is not indicative of future results.
