USD/JPY Breaks into the 147 Yen Range, Focus Shifts to Emerging Trend【JULY9, 2025】
Fundamental Analysis
U.S. trade balance improves — Will investment in the U.S. accelerate?
A potential 25% tariff on Japanese goods could have a significant impact.
USDJPY Technical Analysis
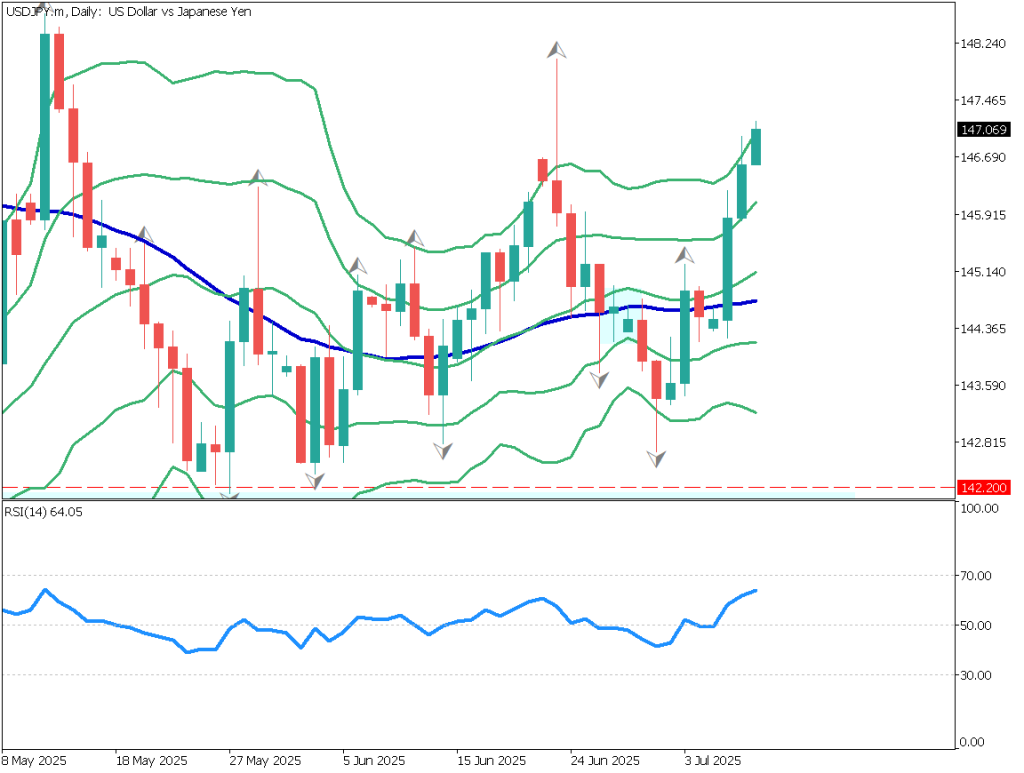
An analysis of the USD/JPY daily chart shows a third consecutive day of gains, with prices touching the +2σ line of the Bollinger Bands.
The pair has now entered the 147 yen range, reacting with yen weakness. Although the Nikkei 225 has pulled back from the 40,000 level, the decline is not substantial.
For Japanese companies, the only way to avoid tariffs is to ramp up production in the U.S. This fundamentally suggests a reduction in the U.S. trade deficit with Japan, resulting in a weaker yen.
Lows are rising, and highs are breaking out — suggesting the potential emergence of a major trend worth close attention.
USDJPY/Daily
Day Trading Strategy (1-Hour Chart)
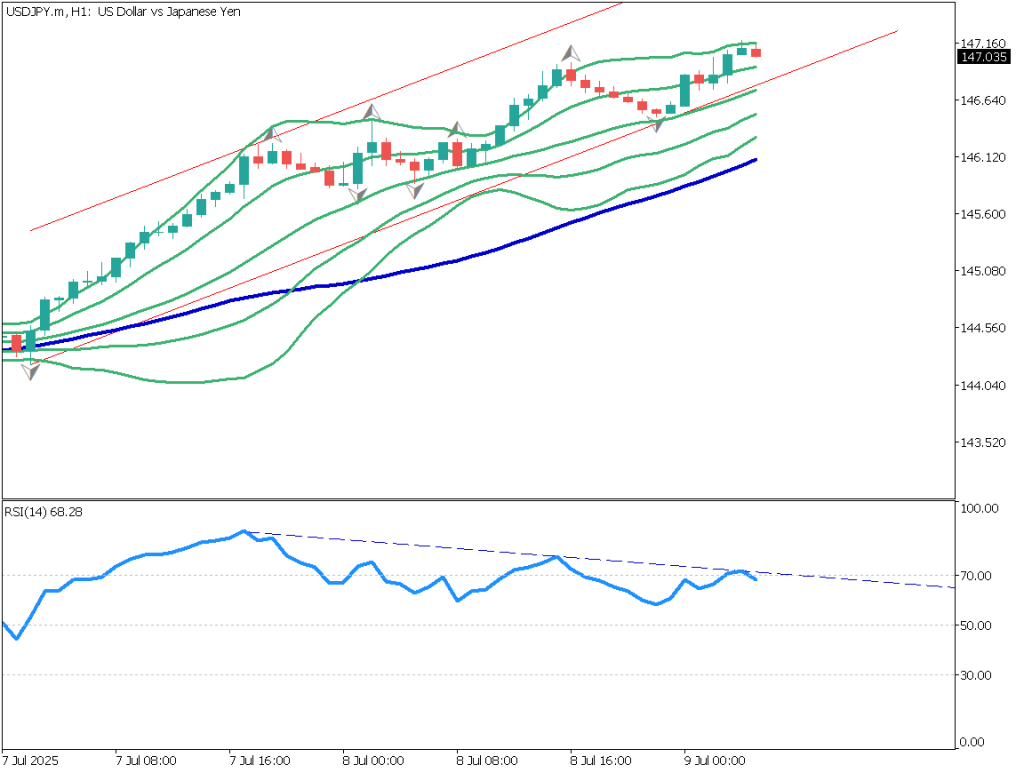
The 1-hour chart shows a mild upward wave forming, with an ascending channel that is gradually pushing prices higher.
However, the RSI shows lower highs, indicating weakening upward momentum — a classic divergence signal.
From a short-term perspective, a pullback seems likely. The fact that prices have touched the +2σ line on the daily Bollinger Bands should also be taken into account.
With a bullish bias, a dip-buying strategy is preferred:
Buy Limit: 146.15
Take Profit: 148.00
Stop Loss: 145.80
USDJPY/1H
Support and Resistance Levels
Support and resistance levels to watch going forward:
148.00 – Previous high
146.00 – +1σ line on Bollinger Bands
Market Sentiment
USDJPY
- 71% short / 29% long
Key Economic Events Today
Event/Indicator*Time(JPT)*U.S. Crude Oil Inventories23:30*U.S. Crude Oil Inventories*03:00 (next day)
Risk Disclaimer
This analysis is for educational purposes only and does not constitute investment advice. Trading forex and CFDs involves significant risk and may not be suitable for all investors. Past performance is not indicative of future results.
