USD/JPY Falls, Bearish Trend Intensifies【November 28, 2023】
Fundamental Analysis
USD/JPY Falls, Ichimoku Standard Line Acts as Resistance
RSI Near 50 Indicates Weakening, Signaling a Strengthening Bearish Trend
If the daily Ichimoku cloud is breached at the closing price, it would be the first time since April
USDJPY Technical Analysis
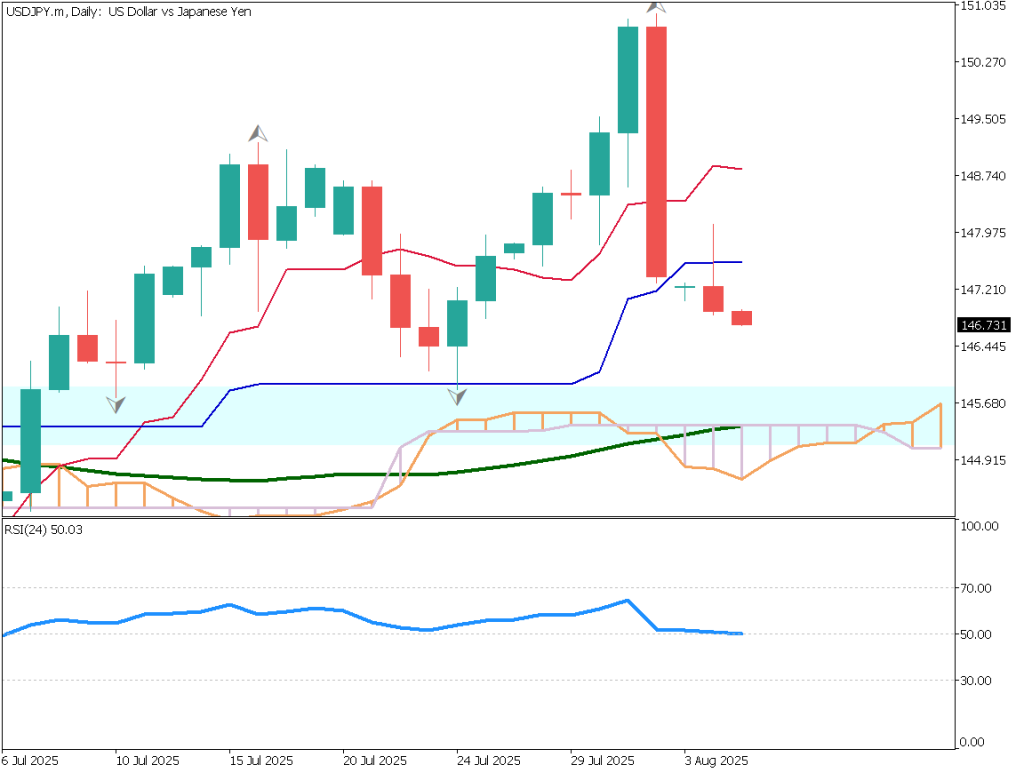
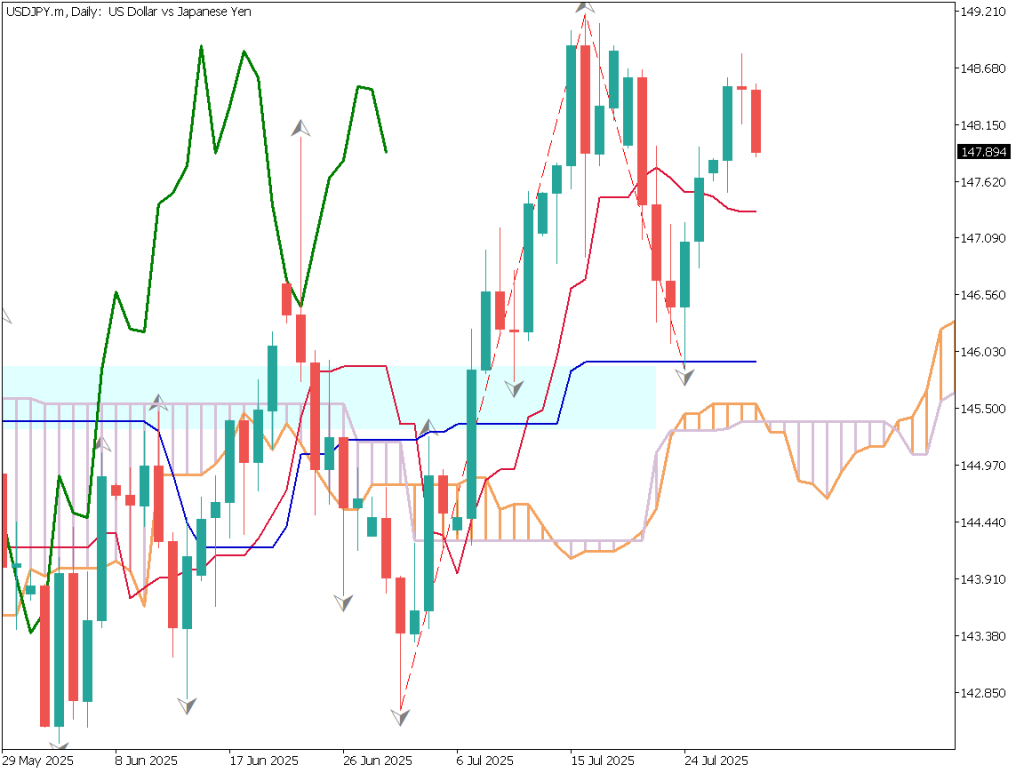
Analyzing the daily chart of USD/JPY. Currently, it is fluctuating within the Ichimoku cloud, indicating a tug of war between bullish and bearish pressures, with a slight dominance of the bearish trend.
Particularly noteworthy is the movement below the 72-day moving average. In the Ichimoku chart, the standard line is acting as resistance, and with the price below the conversion line, a shift towards a bearish trend requires attention.
If the Ichimoku cloud is breached at the closing price, it could signal a significant technical shift for the first time in about half a year.
Day Trading Strategy (1-Hour Chart)
Analyzing the 1-hour chart of USD/JPY. Currently, it’s in a typical selling phase, with the 240 moving average consistently indicating a downward trend. Despite approaching the 72 moving average, the price falls again without touching it.
Analyzing the RSI, which shows a value of 32, indicates an oversold zone. However, considering the movement in higher timeframes, an intensification of the downward trend is expected. Nevertheless, a rebound is anticipated at some point, suggesting a strategy to sell on the rebound.
The day trading strategy involves selling on the rebound, with an entry point around 148.75 JPY, a take-profit at 147.35 JPY, and a stop-loss at 149.80 JPY.
Support and Resistance Lines
Upcoming resistance lines to consider:
149.80 JPY – Recent rebound high147.20 JPY – Recent low
Market Sentiment
USDJPY – Sell: 59%, Buy: 41%
Today’s Important Economic Indicators
Economic Indicators and EventsJST (Japan Standard Time)Australian Retail Sales9:30Bank of Japan Core CPI14:00U.S. Consumer Confidence IndexMidnight
*Trading advice in this article is not provided by Milton Markets, but by Shu Fujiyasu Jr., a certified technical analyst.
Risk Disclaimer
This analysis is for educational purposes only and does not constitute investment advice. Trading forex and CFDs involves significant risk and may not be suitable for all investors. Past performance is not indicative of future results.
This analysis is for educational purposes only and does not constitute investment advice. Trading forex and CFDs involves significant risk and may not be suitable for all investors. Past performance is not indicative of future results.