USD/JPY Continues to Decline, Breaking Below the Cloud in Ichimoku Kinko Hyo【November 30, 2023】
Fundamental Analysis
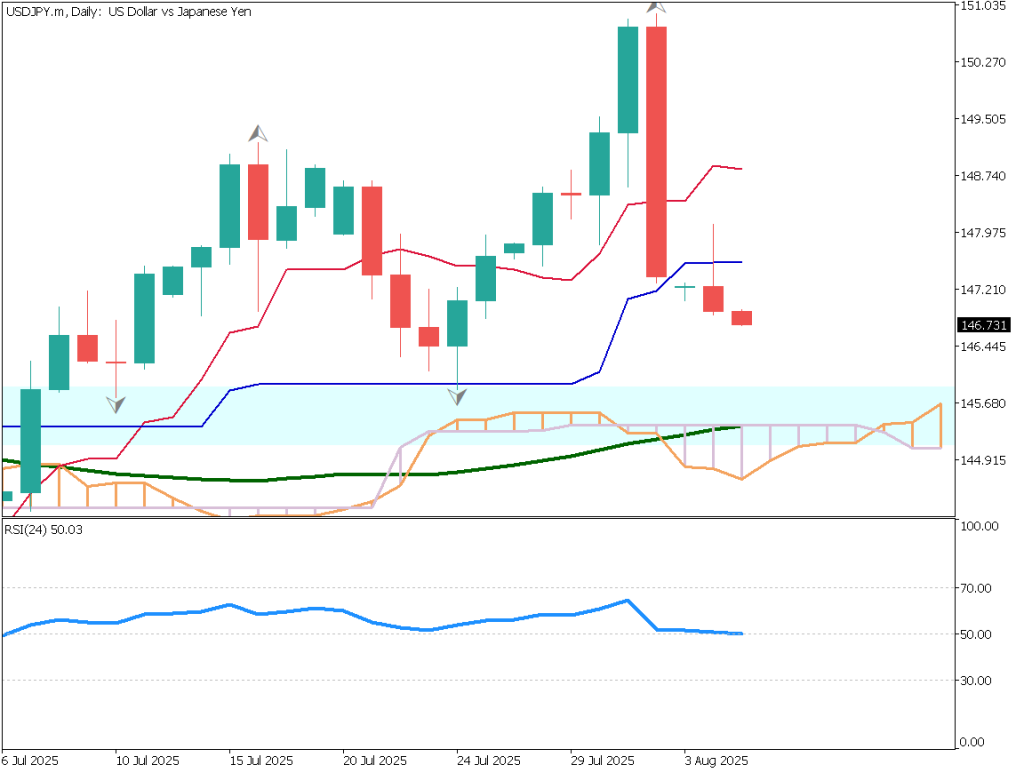
USD/JPY breaks below the cloud in the daily Ichimoku Kinko Hyo chart.
USD/JPY is trading in the early 147 JPY range, reaching price levels not seen since September.
In the forex market, the Yen is strengthening across the board.
USDJPY Technical Analysis
Analyzing the daily chart of USD/JPY. Currently, it is breaking below the 90-day moving average, indicating a strengthening downward trend. The close below the Ichimoku Kinko Hyo cloud is a technically significant signal, likely to trigger new selling pressure.
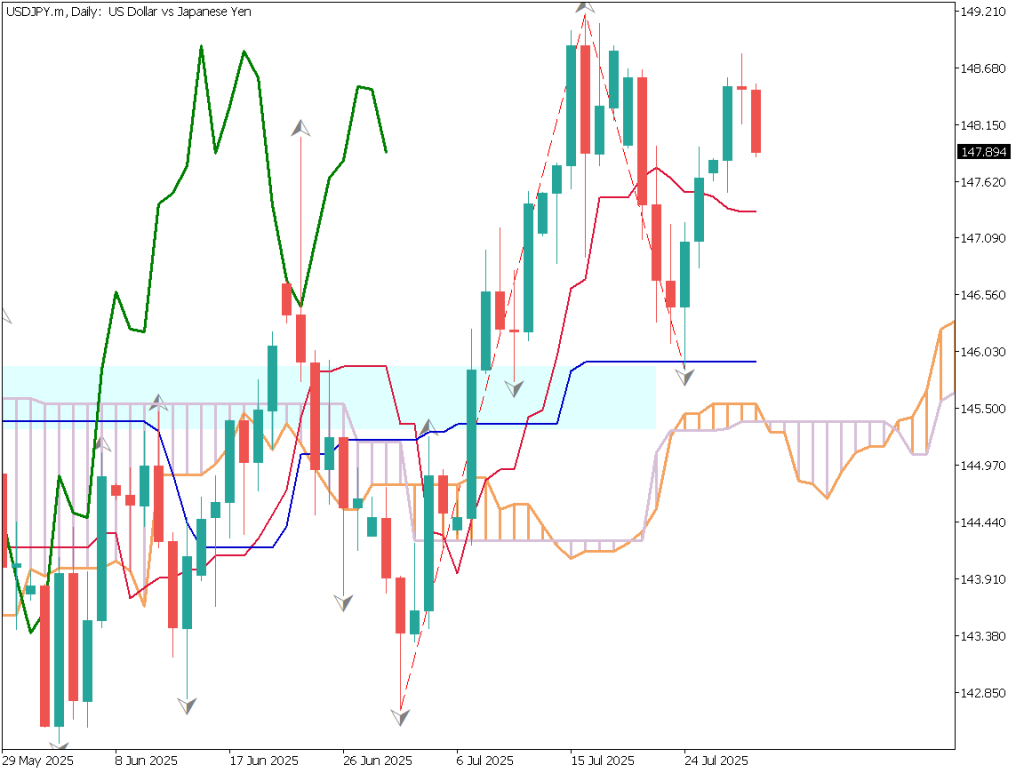
Although there was a rebound within the cloud previously, leading to a rise up to the 150 JPY range, the current break below the cloud holds significant meaning. The market is beginning to factor in a rate cut in the US, contributing to the decline in USD/JPY.
Looking ahead, selling pressure is intensifying, but caution is warranted today due to potential significant movements at the month’s end.
Day Trading Strategy (1-Hour Chart)
Analyzing the 1-hour chart of USD/JPY. Currently, there is a continuation of lower lows, forming a typical downward trend. The 240 moving average line indicates a strong downward trend.
In Ichimoku Kinko Hyo, although the conversion line is above the base line, the overall market is in a downtrend, and a break below the base line could further increase selling pressure. A key level to watch is whether it breaks below the recent low of 146.67 JPY, which would reinforce the downward trend.
Day trading strategy favors selling. Entry at 147.35 JPY, target at 146.78 JPY, and stop loss at 147.55 JPY.
Support and Resistance Lines
Upcoming resistance lines to consider:
147.90 JPY – Yesterday’s high146.55 JPY – A historical price threshold
Market Sentiment
USDJPY Sell: 48%, Buy: 52%
Today’s Important Economic Indicators
Economic Indicators and EventsJST (Japan Standard Time)OPEC+ Online Meeting–U.S. Crude Oil Inventory0:30EU Consumer Price Index19:00U.S. Core PCE Price Index22:30Canada GDP22:30
*Trading advice in this article is not provided by Milton Markets, but by Shu Fujiyasu Jr., a certified technical analyst.
Risk Disclaimer
This analysis is for educational purposes only and does not constitute investment advice. Trading forex and CFDs involves significant risk and may not be suitable for all investors. Past performance is not indicative of future results.
This analysis is for educational purposes only and does not constitute investment advice. Trading forex and CFDs involves significant risk and may not be suitable for all investors. Past performance is not indicative of future results.


