USD/JPY Nears 145 JPY, U.S. Inflation Rate Exceeds Expectations and Accelerates【January 12, 2024】
Fundamental Analysis
U.S. CPI exceeds market expectations, indicating accelerated inflation.
Expectations for a U.S. rate cut recede; a March rate cut seems challenging.
USD/JPY rises, but momentum slows in the latter part of NY trading hours.
USDJPY Technical Analysis
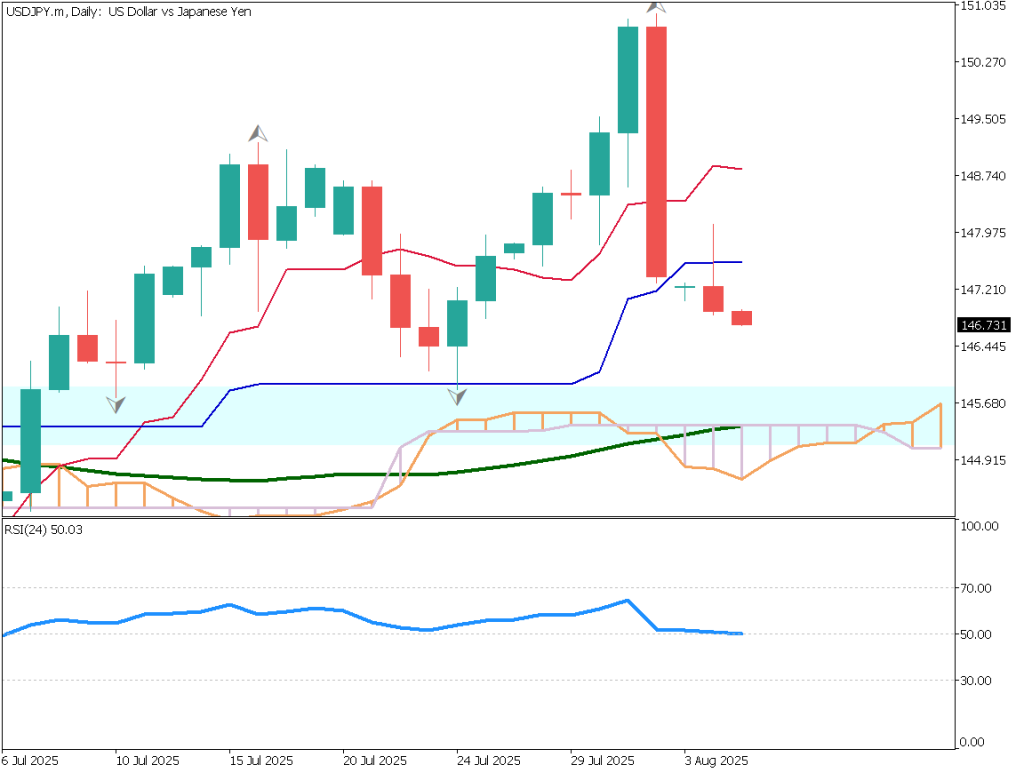
Analysis of USD/JPY’s daily chart. After breaking above the 200-day moving average, it fell post-CPI announcement but this average is acting as a support line. Support levels are at 144.50 JPY, the 38.2% Fibonacci line, and the 200-day moving average. Resistance is seen at the 50% Fibonacci retracement line.The current situation is at a crossroads, deciding whether it is forming a recovery high or continuing an upward trend. RSI is hovering around 50%, indicating unclear market direction. The focus now is on whether the 50% Fibonacci retracement line will be retested and surpassed.
Day Trading Strategy (1-Hour Chart)
Analysis of the USD/JPY 1-hour chart. The 90 moving average line acts as a support, with the price rising to 146.40 JPY post-CPI announcement before slowing down. Falling below this moving average line could lead to further decline.RSI is below 50, at 46, indicating a downtrend. No significant growth is seen after hitting a high, suggesting a potential pullback. The 200-day moving average on the daily chart is around 146.18 JPY; falling below this could lead to further declines. However, it’s too early to adopt a selling strategy.The day trading strategy is to buy on dips, with a buy entry at 144.55 JPY, a take-profit at 145.30 JPY, and a stop-loss at 144.20 JPY.
Support and Resistance Lines
Upcoming significant support and resistance lines:
144.70 JPY: 38.2% Fibonacci line on the daily chart.144.44 JPY: Support line on the monthly chart.
Market Sentiment
USDJPY Sell: 57%, Buy: 43%
Today’s Important Economic Indicators
Economic Indicators and EventsJST (Japan Standard Time)UK Gross Domestic Product (GDP)16:00U.S. Producer Price Index22:30
*Trading advice in this article is not provided by Milton Markets, but by Shu Fujiyasu Jr., a certified technical analyst.
Risk Disclaimer
This analysis is for educational purposes only and does not constitute investment advice. Trading forex and CFDs involves significant risk and may not be suitable for all investors. Past performance is not indicative of future results.
This analysis is for educational purposes only and does not constitute investment advice. Trading forex and CFDs involves significant risk and may not be suitable for all investors. Past performance is not indicative of future results.


