USD/JPY Rises Firmly, Surpassing 145 JPY【January 16, 2024】
Fundamental Analysis
Nikkei Average Continues 8-Day Winning Streak, Increase in Investment Funds with New NISA Operation
USD/JPY Rises Above 145 JPY, Weakening JPY in Sync with Nikkei Average
Immediate Resistance Near 145.50 JPY, Fibonacci Levels in Focus
USDJPY Technical Analysis
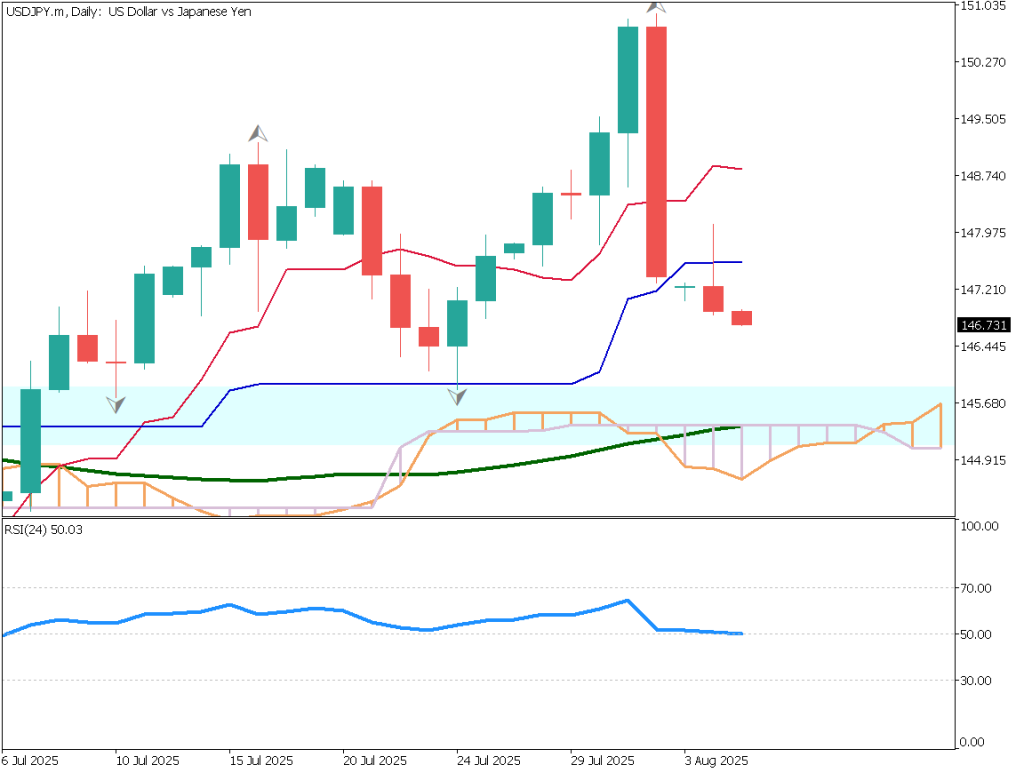
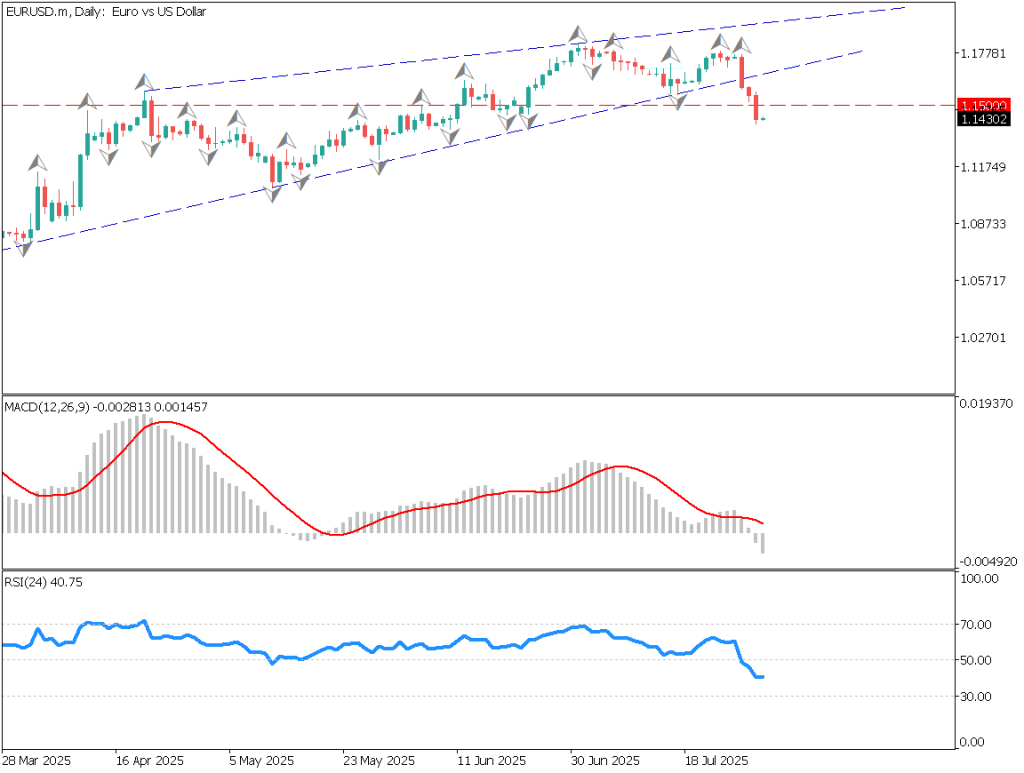
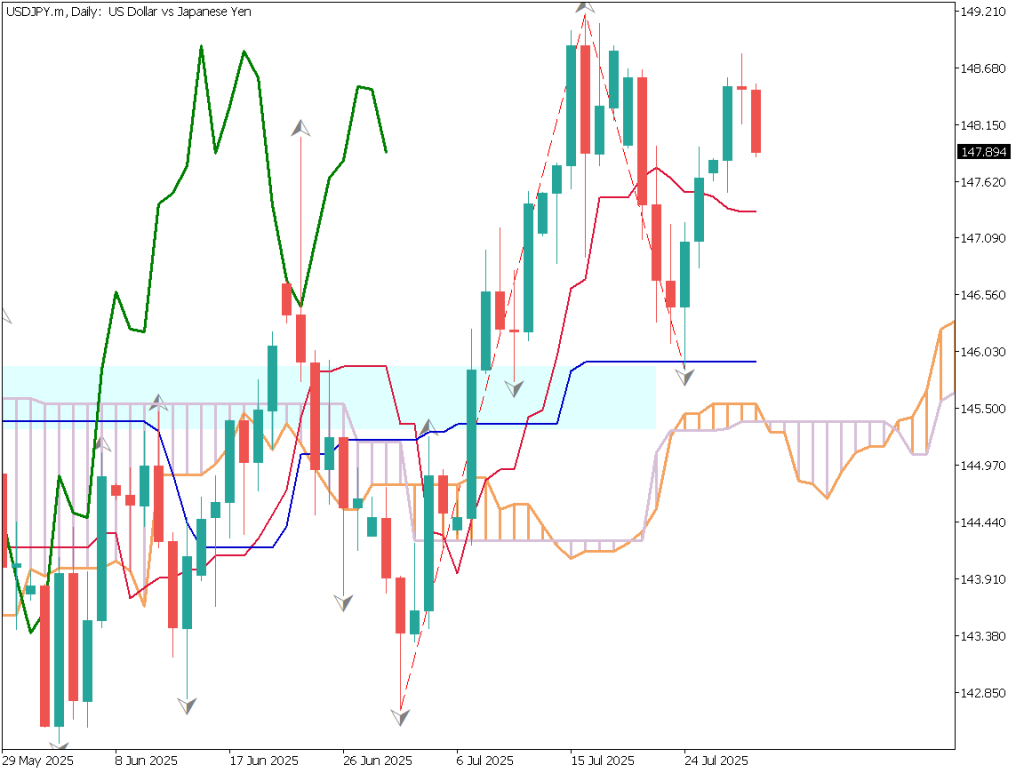
Analyzing the USD/JPY daily chart. Rebounded at the 38.2% Fibonacci retracement, attempting to reach near 146.00 JPY, the 50% price zone. This 50% zone is a strong resistance; breaking above could lead to a range between 146 JPY to 148 JPY. RSI at 51, indicating increasing upward pressure.Reacting to the 240-day moving average, with ongoing battle around the 200-day moving average at approximately 145.25 JPY. Given the strength of the Nikkei and a strong dollar, a continued weakening JPY is expected.
Day Trading Strategy (1-Hour Chart)
Analyzing the USD/JPY 1-hour chart. The upward trend line has shown reactions twice recently, indicating a rebound. Currently maintaining an upward trend, aiming for 145.48 JPY. Breaking above 145.48 JPY could lead to resistance at 146 JPY, with potential for a sharp rise.Even if it drops below the trend line, the 200 moving average might provide support, anticipating some rebound. Considering a contrarian strategy at overbought levels, entry at 146.18 JPY, target at 145.65 JPY, and stop at 146.50 JPY are envisaged.
Support and Resistance Lines
Upcoming significant support and resistance lines:
146.24 JPY: Major resistance line145.48 JPY: Major resistance line
Market Sentiment
USDJPY Sell: 64%, Buy: 36%
Today’s Important Economic Indicators
Economic Indicators and EventsJST (Japan Standard Time)UK Employment Statistics16:00German Consumer Price Index16:00Canadian Consumer Price Index22:30
*Trading advice in this article is not provided by Milton Markets, but by Shu Fujiyasu Jr., a certified technical analyst.
Risk Disclaimer
This analysis is for educational purposes only and does not constitute investment advice. Trading forex and CFDs involves significant risk and may not be suitable for all investors. Past performance is not indicative of future results.
This analysis is for educational purposes only and does not constitute investment advice. Trading forex and CFDs involves significant risk and may not be suitable for all investors. Past performance is not indicative of future results.


