USDJPY Mid-140s, Testing 150 JPY【February 12, 2024】
Fundamental Analysis
US stock indices rise, S&P 500 updates its highest value reaching the 5000s
Increased speculation of further rate hikes in NZ, NZD appreciates
USDJPY faces resistance at 149.50 JPY, breaking through could bring the 150 JPY level into view
USDJPY Technical Analysis
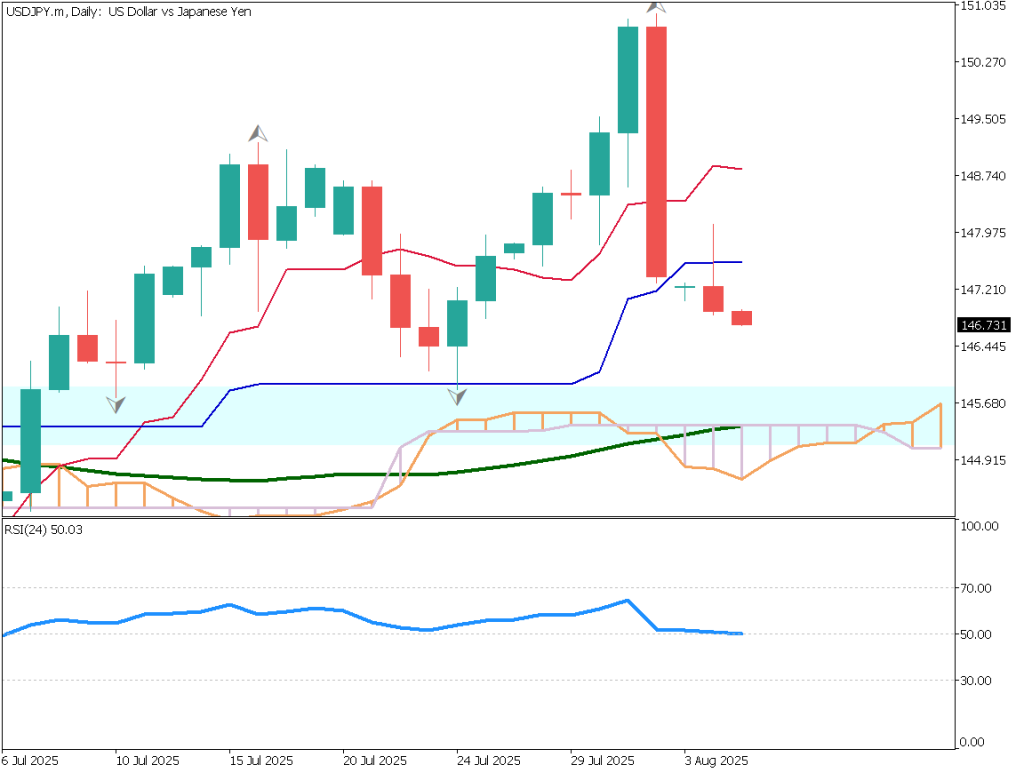
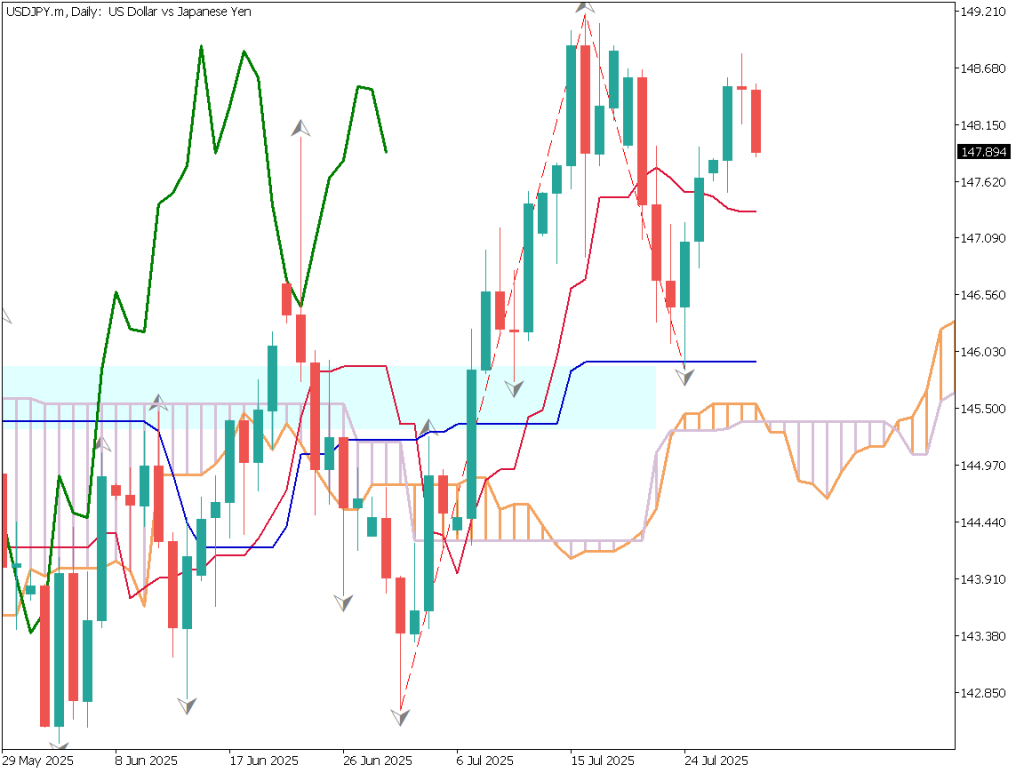
Analyzing the daily chart of USDJPY, it temporarily rose close to 149.50 JPY before falling, showing a doji candlestick pattern. The area above 149.50 JPY is significantly resistant, and it may be difficult to surpass without specific catalysts.
With the US CPI announcement scheduled this week, a cautious stance may prevail until its release. Both the upper and lower limits seem firm, requiring attention to volatility changes.
Day Trading Strategy (1-Hour Chart)
On the 1-hour chart of USDJPY, 149.50 JPY, corresponding to 61.8%, acts as a resistance line. Below, the Ichimoku cloud suggests potential consolidation if entered. The lagging span of the Ichimoku Kinko Hyo is below the candlesticks, with the conversion line below the base line, indicating a signal.
The RSI stands at 51, testing whether it can rebound from 50. Analyzing market sentiment, with over 70% in short positions, surpassing 149.50 JPY clearly could trigger stop losses and lead to a sharp rise.
The day trading approach favors buying on dips. Place a buy limit order at 148.55 JPY, the lower limit of the cloud, with a take-profit at 149.50 JPY and a stop-loss at 148.20 JPY.
Support and Resistance Lines
Upcoming significant support and resistance lines:
149.50 JPY – Current resistance line
Market Sentiment
USDJPY Sell: 72% Buy: 28%
Today’s important economic indicators
Economic indicators and eventsJapan timeEU Economic Outlook19:00Comments from the Governor of the Bank of England3:00 the following day
*Trading advice in this article is not provided by Milton Markets, but by Shu Fujiyasu Jr., a certified technical analyst.
Risk Disclaimer
This analysis is for educational purposes only and does not constitute investment advice. Trading forex and CFDs involves significant risk and may not be suitable for all investors. Past performance is not indicative of future results.
This analysis is for educational purposes only and does not constitute investment advice. Trading forex and CFDs involves significant risk and may not be suitable for all investors. Past performance is not indicative of future results.


