Gold Continues to Hit Record Highs, Risk Aversion Intensifies【February 5, 2025】
Fundamental Analysis
Gold Continues to Set Record Highs, Rising to Around 2,840 USD
Despite absorbing tariff policy changes, market uncertainty remains high.
USDJPY Drops to 154 JPY as Expectations for BOJ Rate Hike Grow
XAUUSD Technical Analysis
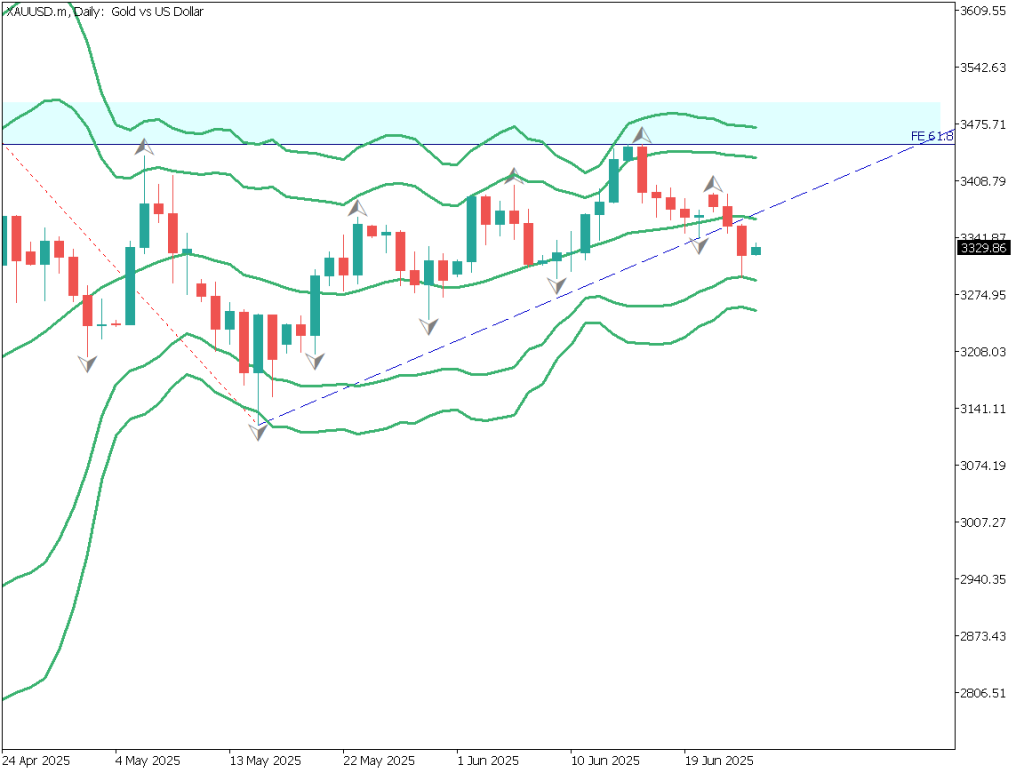
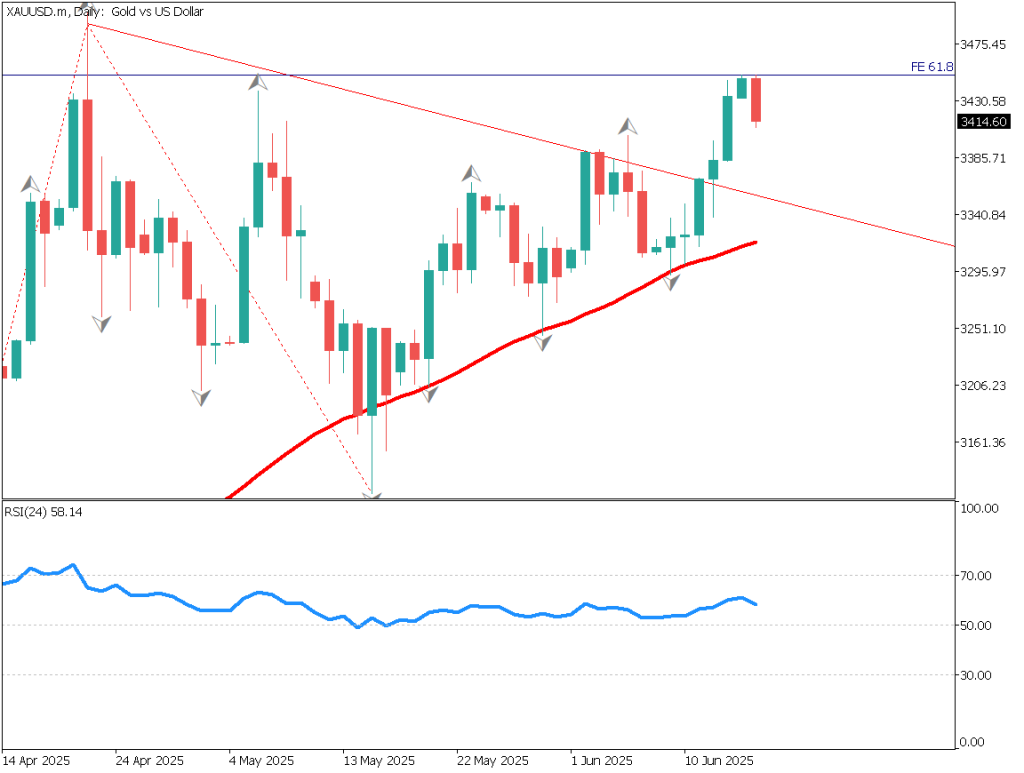
Analyzing the daily chart of gold, we see that it continues to hit record highs. After breaking above 2,800 USD, gold surged to 2,848 USD. Factors such as uncertainty over tariff policies and a rebound in Canada have influenced this movement. Although the stock market is digesting these developments, risk aversion continues to strengthen.
From a technical perspective, the 28-day moving average has crossed above the 90-day moving average, forming a golden cross. According to Granville’s Rule, when a short-term moving average that once dipped below a long-term moving average crosses back above it, it indicates a strong bullish trend.
However, the Stochastic Oscillator is in the overbought zone, suggesting a possible overvaluation. Meanwhile, MACD continues to form a significant peak, confirming the strong upward momentum.
Day trading strategy (1 hour)
Analyzing the 1-hour chart of gold, the 28-period moving average is acting as a support line, with the price rebounding from the short-term moving average, indicating strong bullish momentum. The Stochastic Oscillator is pointing downward, and the MACD histogram shows a weakening upward momentum.
From a fundamental perspective, a buy-on-dip strategy remains favorable.
Day Trading Plan:
Entry: Place a limit buy order around 2,830 USD, expecting a rebound.
Stop Loss: If the price falls below 2,825 USD, exit the trade.
Take Profit: If the price rises to 2,872 USD, close the position.
Support/Resistance lines
Key support and resistance lines to consider:
2,855 USD – Pivot R1
2,833 USD – Monthly Support Line
Market Sentiment
XAUUSD: Sell: 65% / Buy: 35%
Today’s important economic indicators
Economic Indicators and EventsJapan TimeJapan Nikkei Services PMI9:30US ADP Non-Farm Employment Change22:15US Services PMI23:45US ISM Non-Manufacturing Index00:00 (Midnight)
*Trading advice in this article is not provided by Milton Markets, but by Shu Fujiyasu Jr., a certified technical analyst.
Risk Disclaimer
This analysis is for educational purposes only and does not constitute investment advice. Trading forex and CFDs involves significant risk and may not be suitable for all investors. Past performance is not indicative of future results.
This analysis is for educational purposes only and does not constitute investment advice. Trading forex and CFDs involves significant risk and may not be suitable for all investors. Past performance is not indicative of future results.


