US Stock Indices Plunge, USDJPY Drops to 147 JPY【March 7, 2025】
Fundamental Analysis
Tariffs on Canadian and Mexican Automobiles Delayed by One Month
No Market Easing Effect, US Stocks Plummet
USDJPY Falls to 147 JPY, Will the Yen Appreciation Trend Continue?
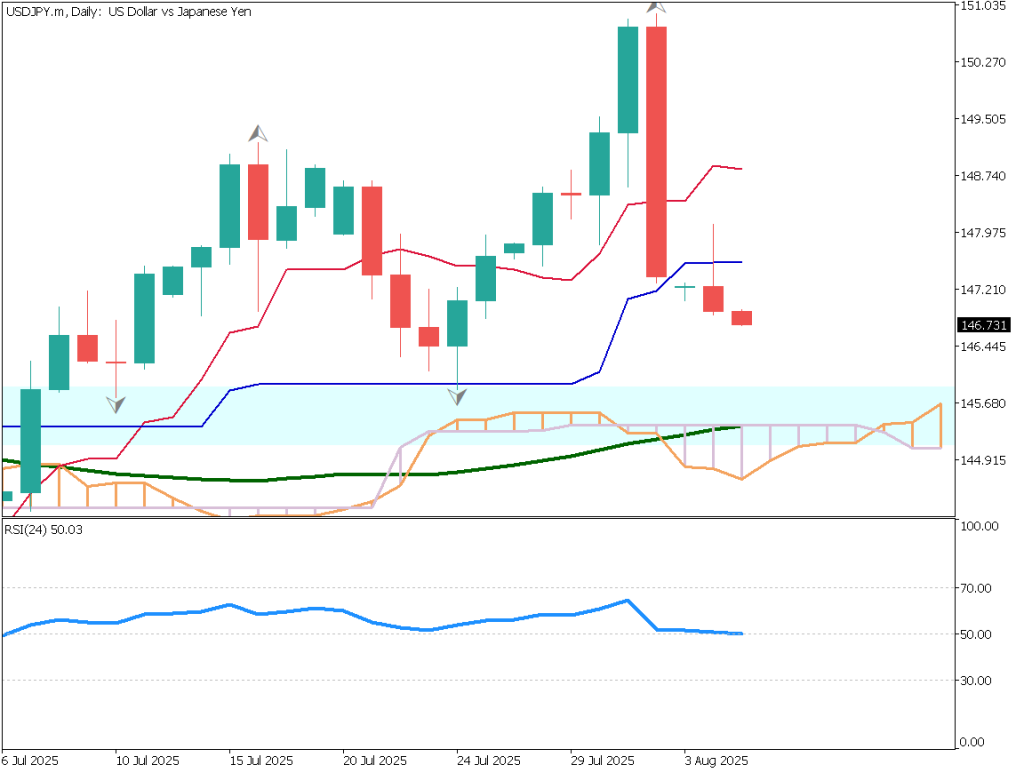
USDJPY Technical Analysis
Analyzing the daily chart of USDJPY, a rebound high has formed near the 200-day moving average, strengthening the downtrend and pushing the pair into the 147 JPY range.
Drawing a Fibonacci retracement, the 50% level at 150.50 JPY is a key resistance, while the current price is influenced by the 38.2% level. If the pair breaks below 38.2%, the next potential support is at the 23.6% level, corresponding to 144.87 JPY.
Today, the US Non-Farm Payrolls (NFP) report is scheduled. If the figures come in lower than expected, the market is likely to react sensitively. Traders should stay alert.
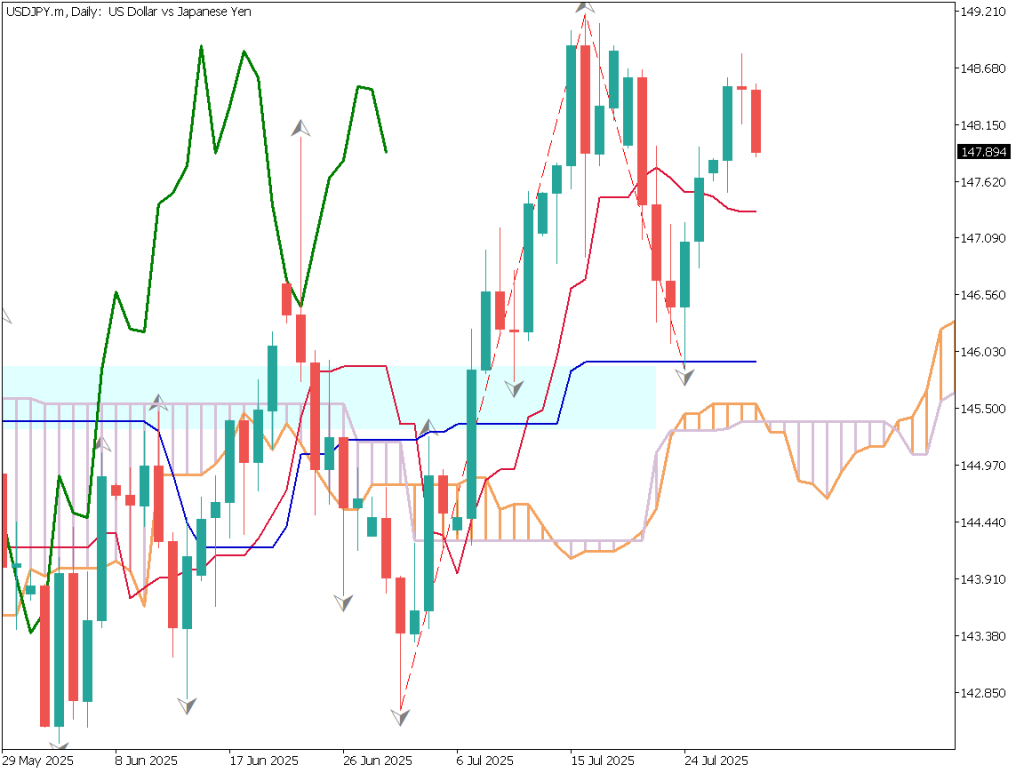
Day trading strategy (1 hour)
Analyzing the 1-hour chart of USDJPY, a descending channel is forming, with the upper band around 148.50 JPY. The highs are gradually declining, indicating a continued downtrend.
Today’s Day Trading Plan:
Sell on rebounds while ensuring all positions are closed before the US Non-Farm Payrolls release.
Sell limit order at 149.50 JPY, targeting 147.50 JPY, and stop-loss above 150 JPY.
Support/Resistance lines
Key support and resistance lines to consider:
Around 149 JPY – Upper boundary of the ascending channel
147.310 JPY – Recent low
Market Sentiment
USDJPY: Sell: 41% / Buy: 59%
Today’s important economic indicators
Economic Indicators and EventsJapan TimeEU GDP19:00US Non-Farm Payrolls22:30
*Trading advice in this article is not provided by Milton Markets, but by Shu Fujiyasu Jr., a certified technical analyst.
Risk Disclaimer
This analysis is for educational purposes only and does not constitute investment advice. Trading forex and CFDs involves significant risk and may not be suitable for all investors. Past performance is not indicative of future results.
This analysis is for educational purposes only and does not constitute investment advice. Trading forex and CFDs involves significant risk and may not be suitable for all investors. Past performance is not indicative of future results.