U.S. Administration Notifies Tariff Rates to Various Countries; Gold Seeks Direction【JULY10, 2025】
Fundamental Analysis
The U.S. administration announced a 50% tariff on Brazil.****
Prices of copper, silver, and other precious metals surged.****
XAUUSD Technical Analysis
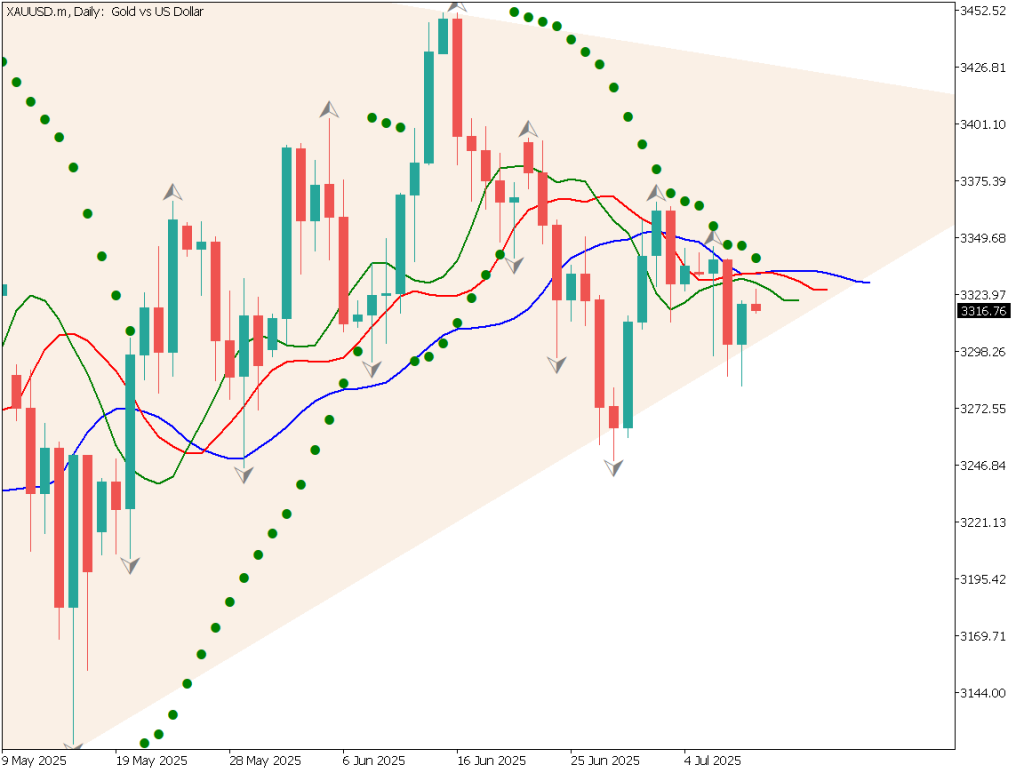
Analyzing the daily chart of gold shows a triangle pattern forming, with lower highs and higher lows indicating a lack of clear direction. Currently, the market is in a range around 3300USD.
Let’s explore possible movements ahead. The Alligator indicator, developed by Bill Williams, shows the long-term > medium-term > short-term moving averages aligned from top to bottom, signaling a bearish outlook.
The price is approaching the lower trendline of the triangle pattern, so we should watch for a potential breakout. The Parabolic SAR, often used for stop-and-reverse strategies, is positioned above the candlesticks, which also supports a bearish stance unless a buy signal is triggered.
XAUUSD/Daily
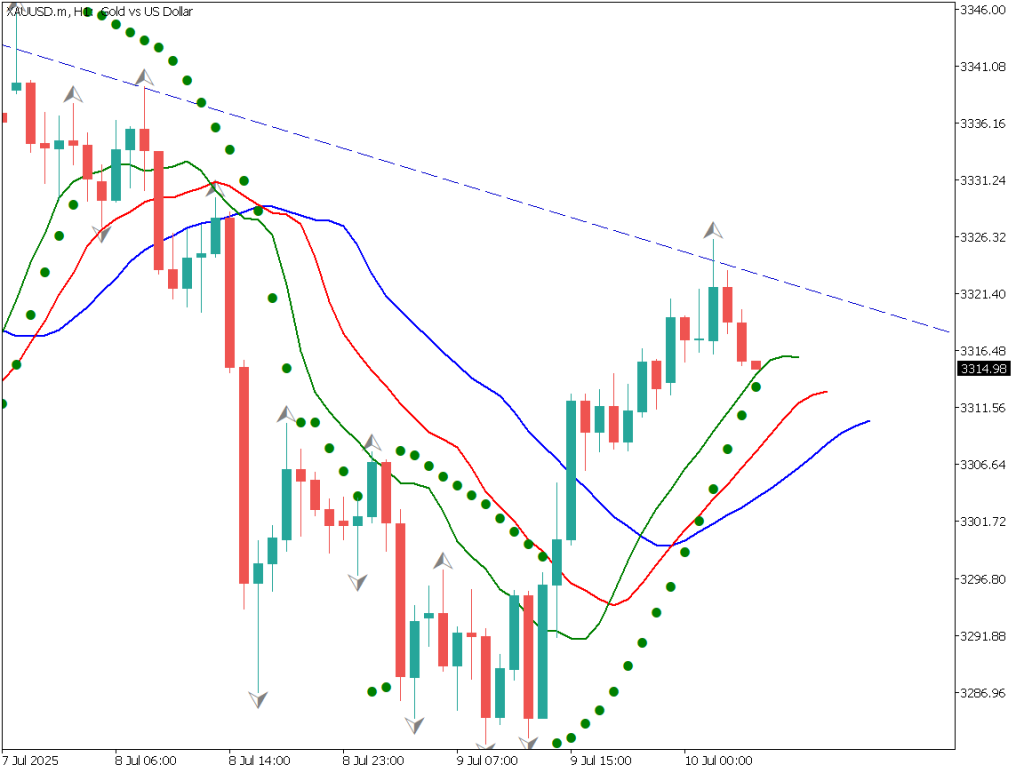
Day Trading Strategy (1-Hour Chart)
**On the 1-hour chart, the price is reacting to a descending trendline and has rebounded. The Parabolic SAR is below the candlesticks on the 1-hour chart, making it difficult to justify a short entry. **
**Additionally, the Alligator lines are opening upward. **
There’s a conflict between the daily and hourly charts. However, with many stop-loss orders likely below current levels, a downside breakout could lead to a measurable decline.
** For short-term trades, consider a new short position when a Parabolic SAR sell signal appears. For medium- to long-term strategies, consider buying around the 3280USD level if the price drops.**
XAUUSD/1H
Support and Resistance Levels
Support and resistance levels to watch going forward:
3320USD – Short-term Alligator
3282USD – Recent daily low
Market Sentiment
XAUUSD
- 47% short / 53% long
Key Economic Events Today
| Event/Indicator | Time(JPT) |
| --- | --- || Japan – Domestic Corporate Goods Price Index8:50U.S. – Initial Jobless Claims | 21:30 |
| --- | --- |
Risk Disclaimer
This analysis is for educational purposes only and does not constitute investment advice. Trading forex and CFDs involves significant risk and may not be suitable for all investors. Past performance is not indicative of future results.
This analysis is for educational purposes only and does not constitute investment advice. Trading forex and CFDs involves significant risk and may not be suitable for all investors. Past performance is not indicative of future results.