Gold Rises, Fundamentals Change from Risk Aversion to Rate Cut Expectations【November 27, 2023】
Fundamental Analysis
Expectations of USD rate cuts from next year onwards drive gold higher, with focus on interest rate trends
Gold recovers to the USD 2,000 range, targeting the recent high of USD 2,009
Fundamentals shift from risk aversion to rate cut expectations
XAUUSD Technical Analysis
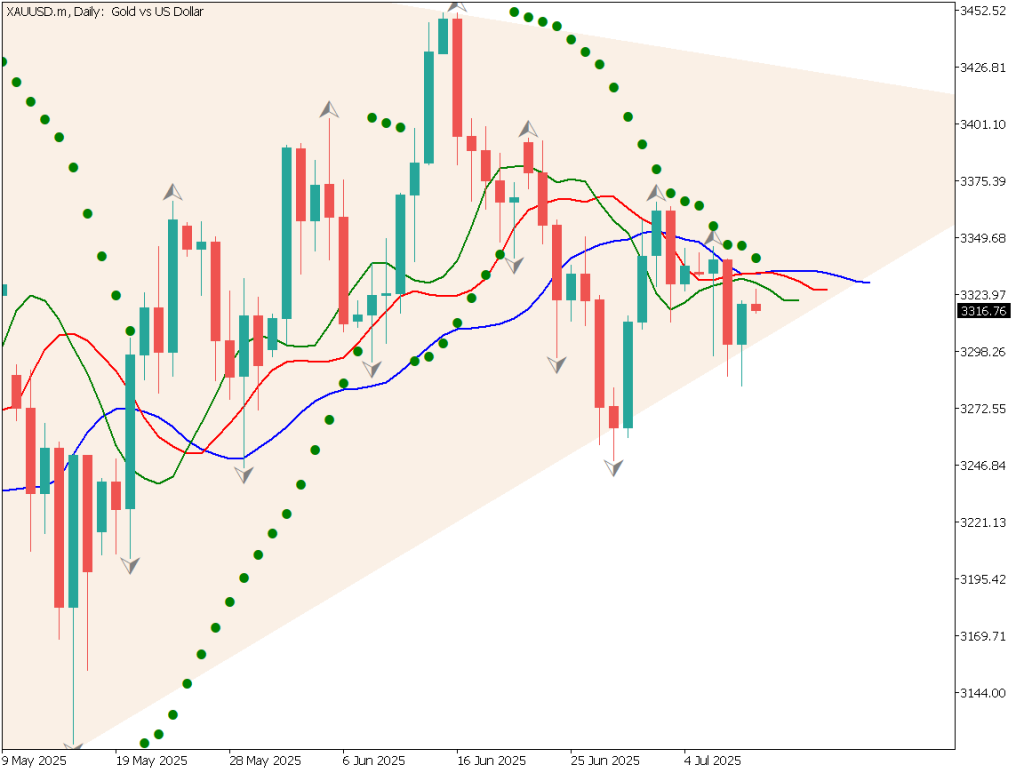
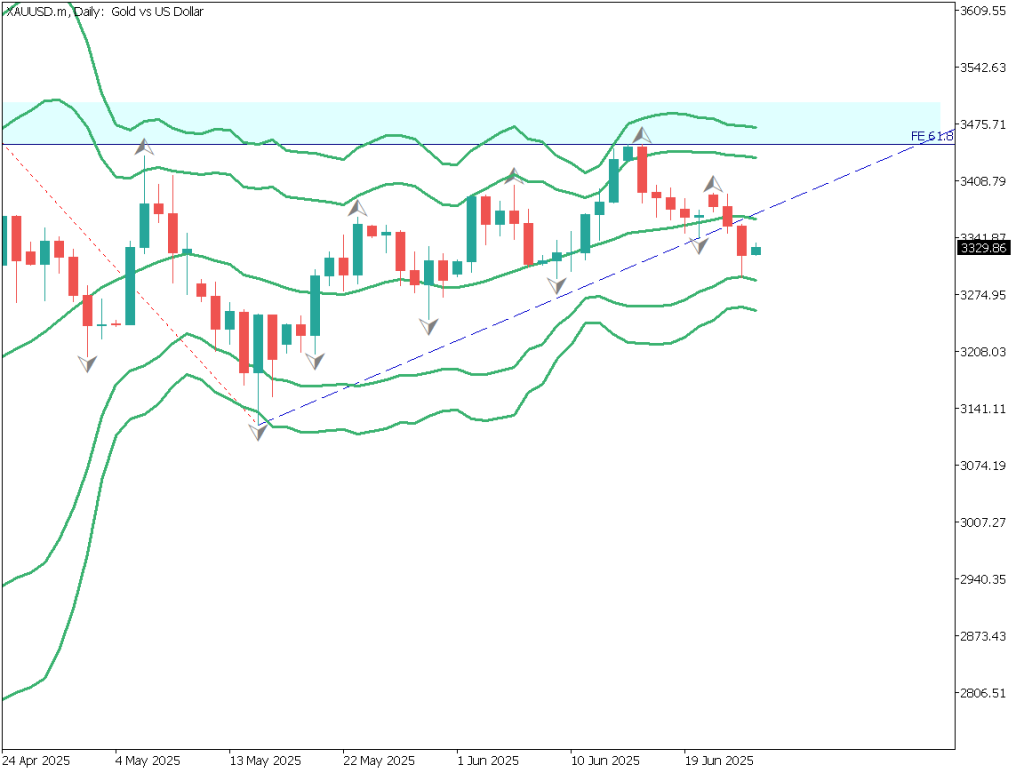
Analyzing the daily chart of gold prices. Currently, the 240-day moving average line is strongly considered, with visible rebounds at this line.
The RSI also rebounds at 50, indicating a continued uptrend. Drawing Fibonacci expansion between recent highs and lows, USD 2,053 corresponds to 61.8%. Key past highs at USD 2,007 and USD 2,032 are expected to be significant.
In fundamental analysis, interest rate speculation is currently more important in the market than the Middle East conflict. It is important to pay attention to market reactions, especially at price levels like USD 2,053, USD 2,007, and USD 2,032.
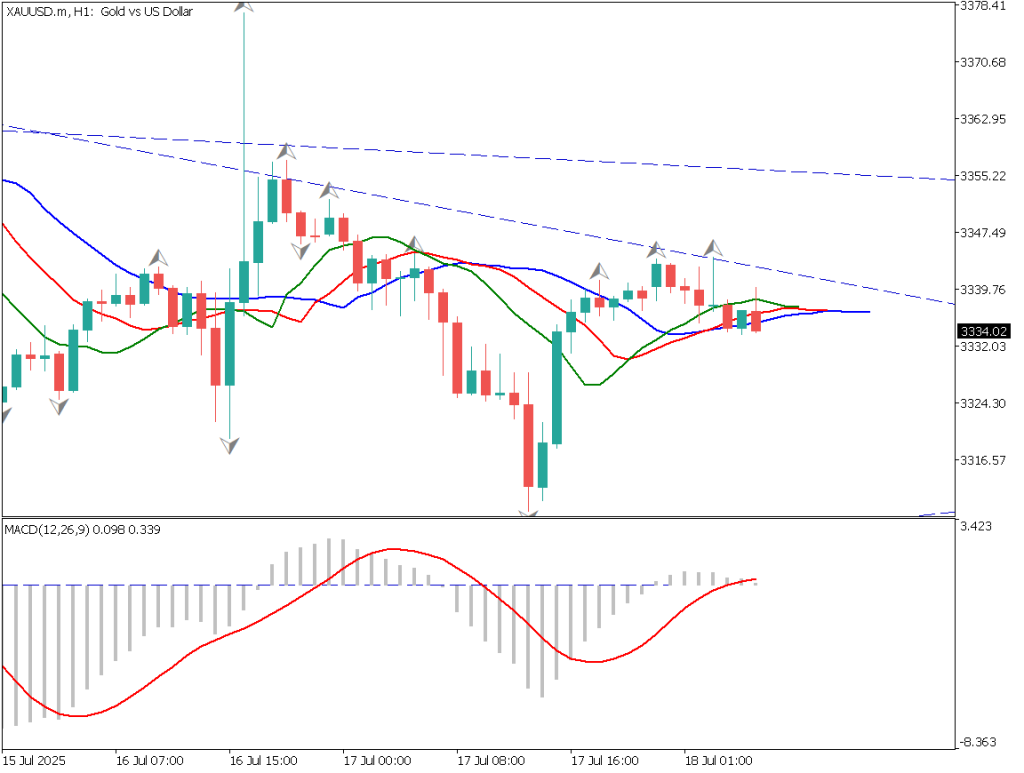
Day Trading Strategy (1-Hour Chart)
Analyzing the 1-hour chart of gold prices. Currently, an upward trend line can be drawn, with the USD 2,007 resistance level being an upper limit. The RSI has risen to 61, continuing an upward trend aiming for 70. Buying on dips when approaching the upward trend line seems to be a desirable trading strategy.
For day trading, it would be appropriate to take a long position, entering at USD 1,995, exiting at USD 2,007, and setting a stop loss at USD 1,990.
Support and Resistance Lines
Upcoming resistance lines to consider:
USD 2,007.5 – Past key highUSD 2,009 – Recent high on the daily chart
Market Sentiment
XAUUSD – Sell: 72%, Buy: 28%
Today’s Important Economic Indicators
Economic Indicators and EventsJST (Japan Standard Time)U.S. Building Permits22:00U.S. New Home SalesMidnight
*Trading advice in this article is not provided by Milton Markets, but by Shu Fujiyasu Jr., a certified technical analyst.
Risk Disclaimer
This analysis is for educational purposes only and does not constitute investment advice. Trading forex and CFDs involves significant risk and may not be suitable for all investors. Past performance is not indicative of future results.
This analysis is for educational purposes only and does not constitute investment advice. Trading forex and CFDs involves significant risk and may not be suitable for all investors. Past performance is not indicative of future results.


