Gold May Form a Ceiling, Downward Trend as US Rate Cut Expectations Fade【December 11, 2023】
Fundamental Analysis
US employment statistics exceed market expectations, mixed economic indicator results
This week features the FOMC meeting, with interest rate trend forecasts also scheduled to be announced
Gold temporarily falls below USD 2000, suggesting a ceiling with the emergence of a candlestick pattern
XAUUSD Technical Analysis
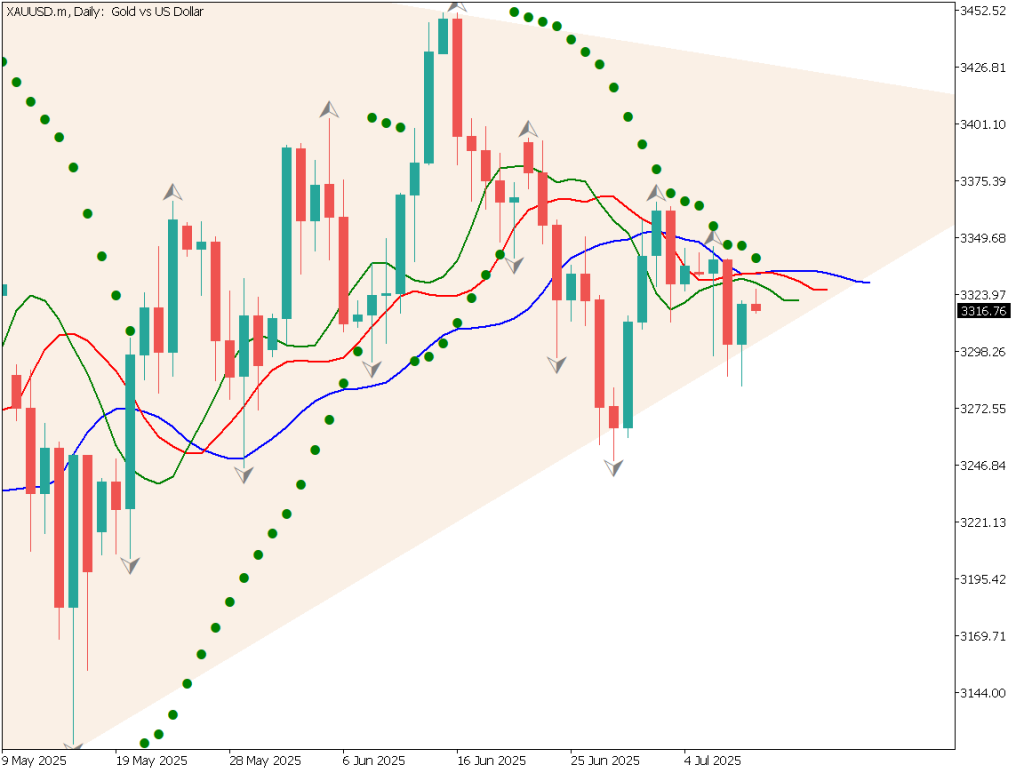
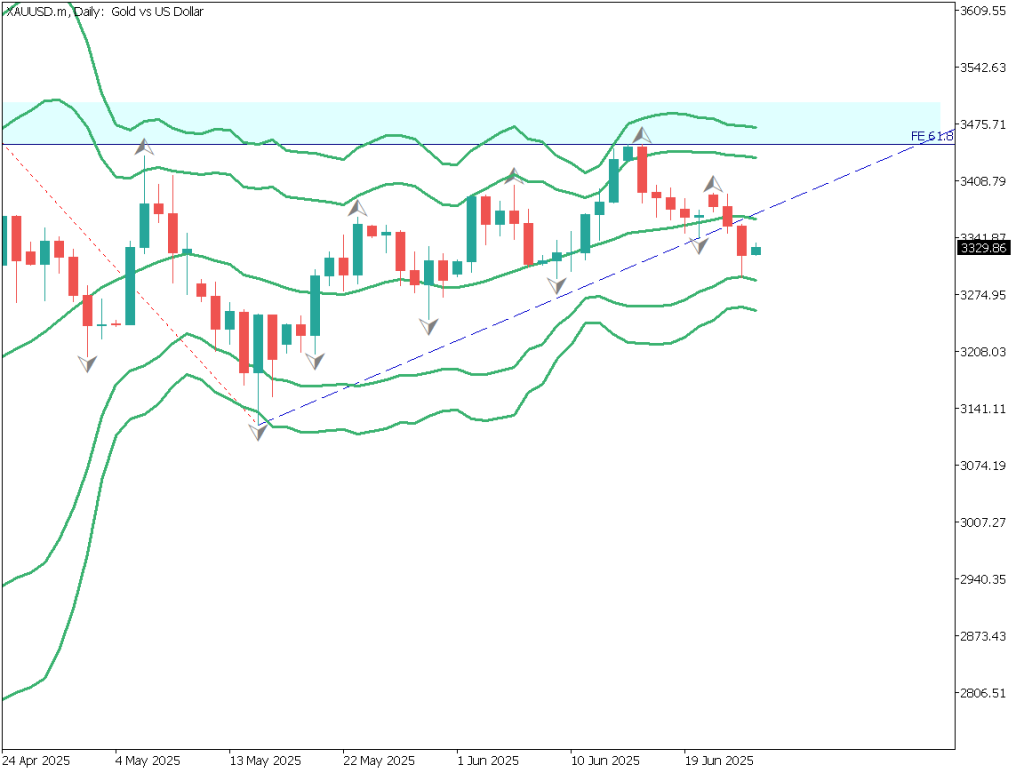
Analyzing the daily chart of the gold market. After updating the historical high, the upward momentum is lost. Excessive rate cut expectations following the US employment statistics are fading, breaking through the lower support line. Currently, it has broken below the 38.2% support line, with a move towards the 50% level, i.e., USD 1972, anticipated.
This week’s US FOMC meeting will announce the policy interest rate and future interest rate trends. This could change the direction of gold. The RSI is moving at 52, and whether it falls below 50 is also noteworthy.
Day Trading Strategy (1-Hour Chart)
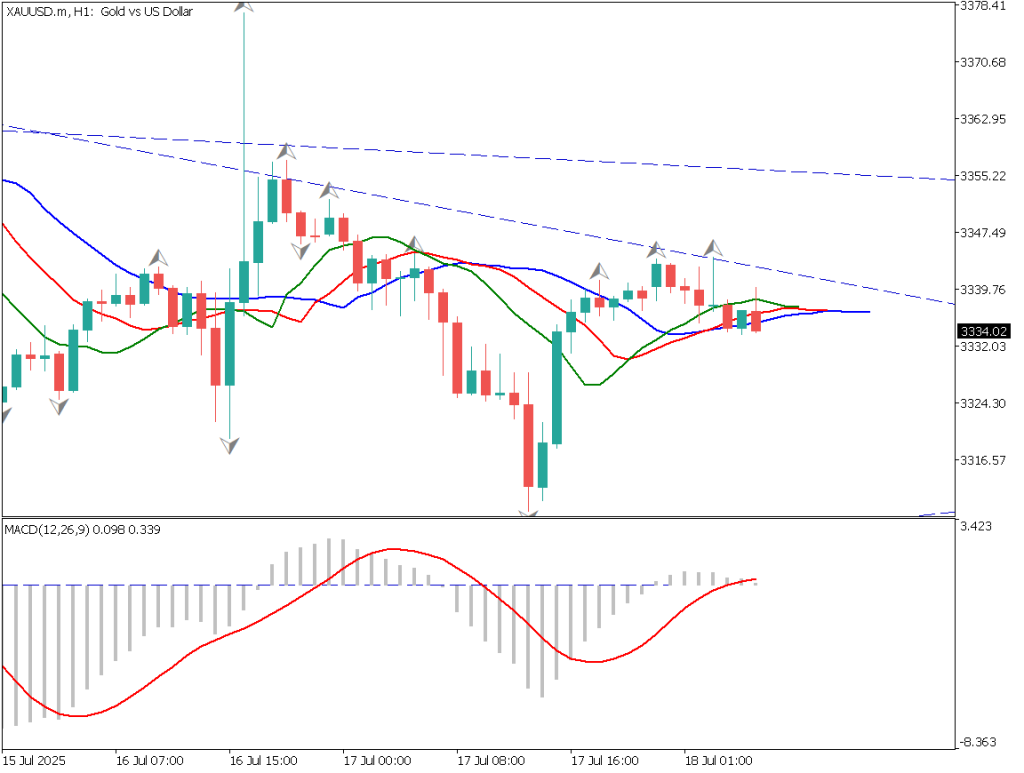
Analyzing the 1-hour chart of the gold market. Currently, it shows a small inverse N-shape, breaking out of the range market downwards. Having fallen below USD 2009.5, there is a possibility of further decline. However, the RSI has exited the oversold zone and is showing a reversal above 30. Therefore, until the RSI reaches 50, some adjustment movement is expected.
The market sentiment is currently balanced, with a clear direction difficult to discern. In the short term, there are opportunities to look for sell entries at the lower range limit. If the price is drawn to around USD 2015, the baseline of the Ichimoku Kinko Hyo, there might be an opportunity for a sell on rally.
As a day trading strategy, consider selling on a rally with an entry at USD 2015, take profit around USD 1990, and a stop loss at USD 2020.
Support and Resistance Lines
Upcoming resistance lines to consider:
2040 USD – Upper range level2005.50 USD – Lower range level
Market Sentiment
XAUUSD Sell: 55%, Buy: 45%
Today’s Important Economic Indicators
Economic Indicators and EventsJST (Japan Standard Time)Japanese Large Manufacturers’ Business Outlook Index8:50
*Trading advice in this article is not provided by Milton Markets, but by Shu Fujiyasu Jr., a certified technical analyst.
Risk Disclaimer
This analysis is for educational purposes only and does not constitute investment advice. Trading forex and CFDs involves significant risk and may not be suitable for all investors. Past performance is not indicative of future results.
This analysis is for educational purposes only and does not constitute investment advice. Trading forex and CFDs involves significant risk and may not be suitable for all investors. Past performance is not indicative of future results.


