USDJPY Continues Strong Rebound, Caution Against Rising Selling Pressure【August 12, 2024】
Fundamental Analysis
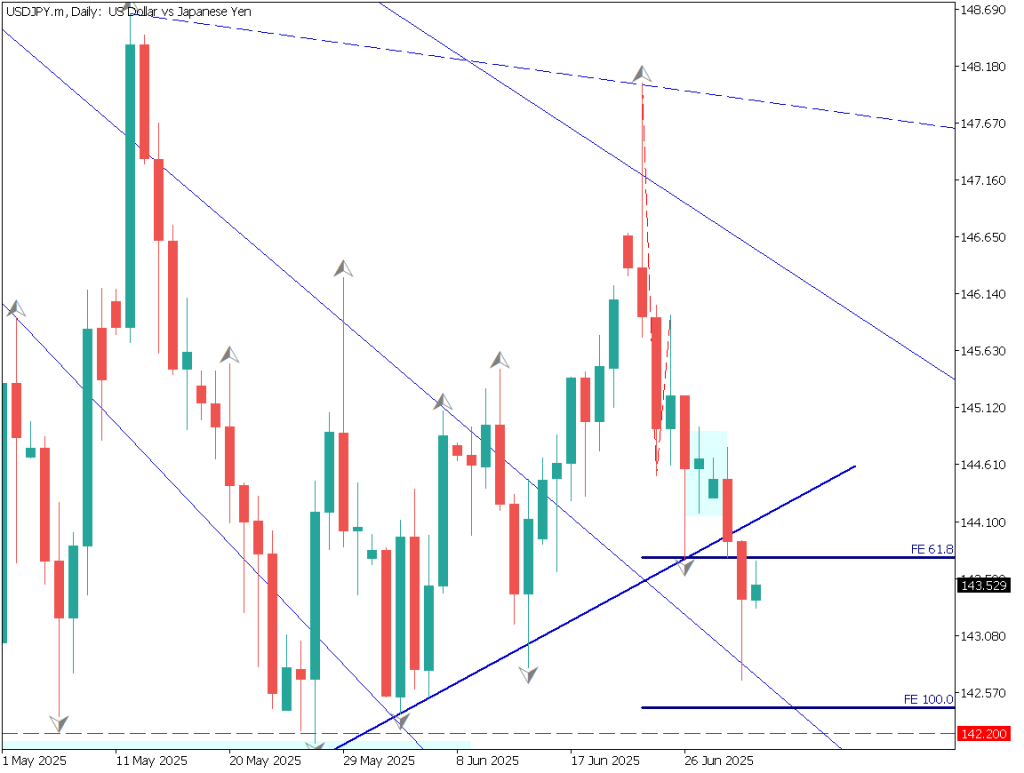
USDJPY is trading around 146.70 JPY, potentially forming a high for a selling opportunity.
Watch the 10-day moving average; breaking above 148 JPY will be a key point.
USDJPY technical analysis
Analyzing the daily chart for USDJPY, after hitting a low of 141 JPY, it continues to rebound and is trading near the 10-day moving average. Drawing the Fibonacci retracement, the 23.6% level acts as support, and attention is focused on whether it will break above the 10-day moving average.
The employment statistics released in early August were weak enough to suggest a recession in the US economy, but last week’s US unemployment insurance claims were lower than expected, easing excessive pessimism. If it breaks above the 10-day moving average, it could rise to around 148.6 JPY.
Day trading strategy (1 hour)
Analyzing the 1-hour chart for USDJPY, a golden cross has formed, and a cloud is providing support beneath the candlesticks. However, the upward momentum seems somewhat heavy, and it has not been able to rise. Selling pressure is considered strong above 147.50 JPY.
The day trading strategy is to sell on rallies. Consider selling at 148.65 JPY, setting a stop at 149.50 JPY, and aiming for a close around 147.10 JPY.
Support/Resistance lines
The following support and resistance levels should be considered going forward:
- 148.65 JPY: Fibonacci Point
Market Sentiment
USDJPY Sell: 49% Buy: 51%
Today’s important economic indicators
Economic indicators and eventsJapan timeOPEC Monthly Report20:00
*Trading advice in this article is not provided by Milton Markets, but by Shu Fujiyasu Jr., a certified technical analyst.
Risk Disclaimer
This analysis is for educational purposes only and does not constitute investment advice. Trading forex and CFDs involves significant risk and may not be suitable for all investors. Past performance is not indicative of future results.
This analysis is for educational purposes only and does not constitute investment advice. Trading forex and CFDs involves significant risk and may not be suitable for all investors. Past performance is not indicative of future results.