Gold Reaches Record High, Strong Results from US ADP and GDP【October 31, 2024】
Fundamental Analysis
The Bank of Japan (BOJ) holds a policy meeting; interest rate hikes are unlikely due to political instability.
US ADP Employment and US GDP data show extremely strong figures.
Gold hits a record high, possibly influenced by Middle East tensions and the upcoming presidential election.
XAUUSD technical analysis
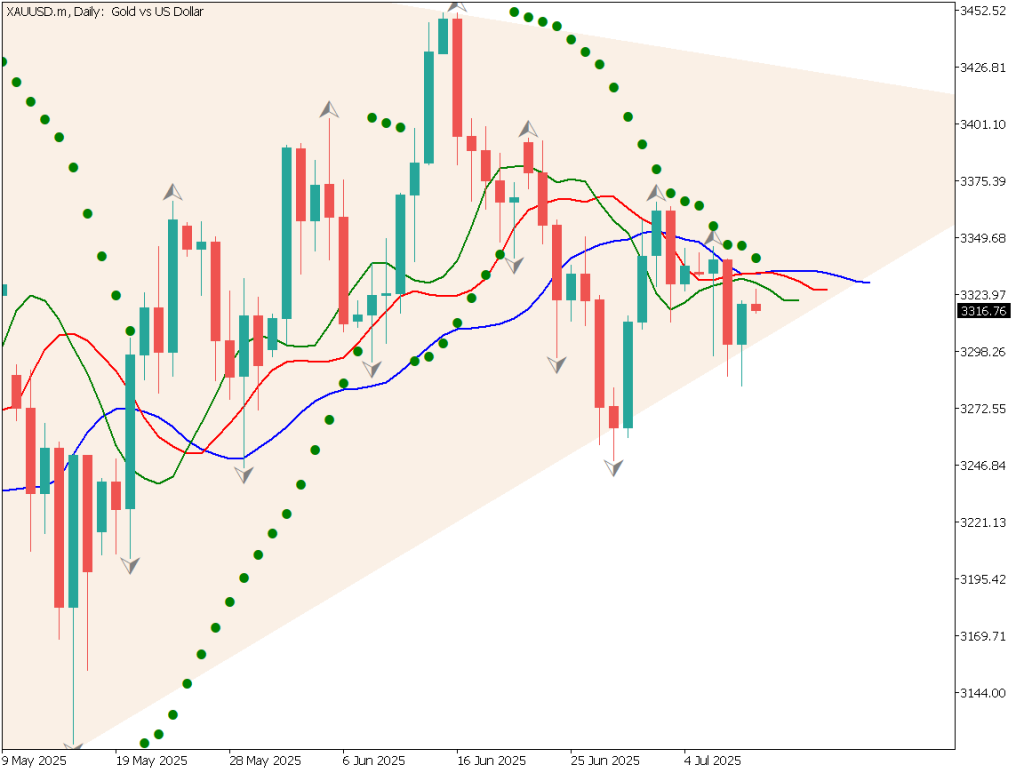
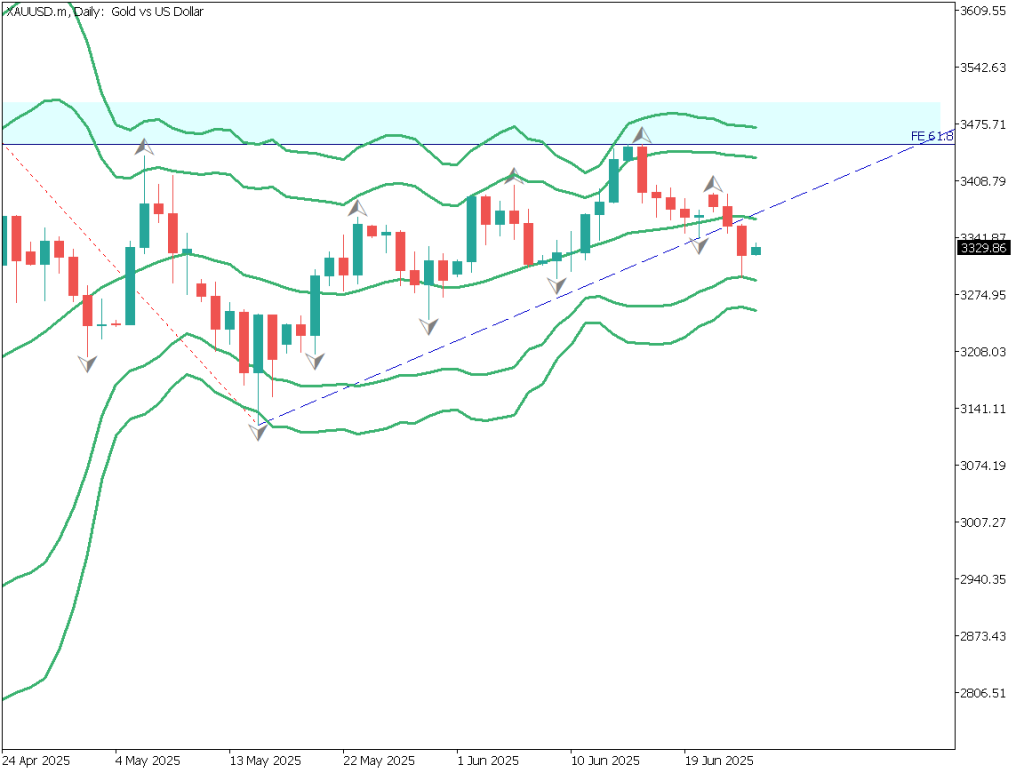
Analyzing the daily chart of Gold, it shows support at the 10-day moving average, breaking through a high of USD 2758 and rising to USD 2790, reaching a new record. The 26-day moving average also acts as support, with buying interest intensifying as the 10-day moving average approaches it.
Currently, as the gap between the 10-day and 26-day moving averages widens, careful attention to potential corrective selling is needed. The RSI (14) stands at 73, indicating an overbought level.
The strong US GDP figures suggest solid personal consumption and significant employment growth. However, there has been no marked increase in USD buying.
A potential factor for Gold’s rise could be the upcoming presidential election. With both candidates’ support rates closely aligned, the outcome remains unpredictable. Risk-aversion trends and seasonal anomalies are driving purchases.
After the election, a temporary lull may bring a substantial correction, warranting caution.
Day trading strategy (1 hour)
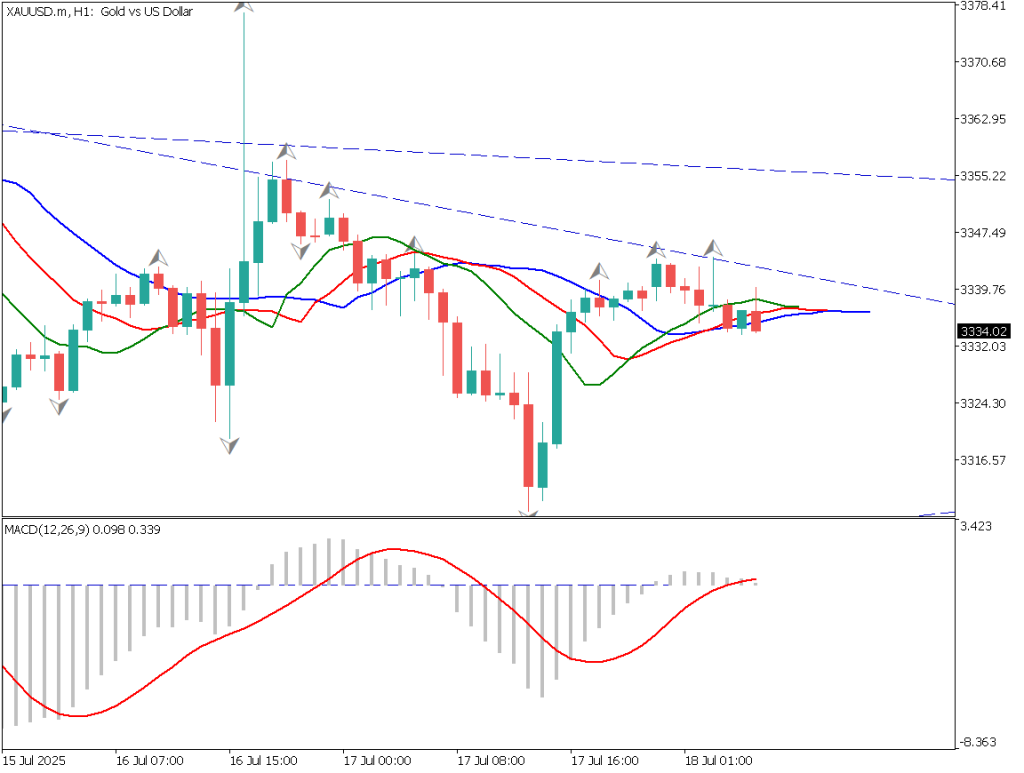
In the hourly chart analysis for Gold, the 10-hour moving average serves as support, indicating an upward trend. However, it has risen near USD 2790, showing signs of a temporary pause. RSI analysis shows declining highs, suggesting a weakening short-term upward trend.
Weekly and daily RSI readings exceed 80, indicating overbought conditions.
Nonetheless, considering the uncertainty of the presidential election, Middle East concerns, and seasonal anomalies, buying pressure on dips remains strong. However, with today marking the final trading day of October, corrective moves may increase.
As a day trading strategy, this could be a good level for a contrarian sell approach. Selling once the 26-hour moving average is clearly breached and taking profit around USD 2760, with a stop if USD 2790 is breached again, would be prudent.
Support/Resistance lines
The following are key support and resistance lines to consider:
USD 2790: Recent high
USD 2758: Recent milestone price
Market Sentiment
XAUUSD – Sell: 65%, Buy: 35%
Today’s important economic indicators
Economic Indicators and EventsJapan TimeBOJ Monetary Policy Announcement11:30BOJ Outlook Report12:00BOJ Policy Rate Announcement12:00BOJ Governor Press Conference15:30EU Consumer Price Index19:00US Core PCE Price Index21:30US Initial Jobless Claims21:30Canada GDP21:30
*Trading advice in this article is not provided by Milton Markets, but by Shu Fujiyasu Jr., a certified technical analyst.
Risk Disclaimer
This analysis is for educational purposes only and does not constitute investment advice. Trading forex and CFDs involves significant risk and may not be suitable for all investors. Past performance is not indicative of future results.
This analysis is for educational purposes only and does not constitute investment advice. Trading forex and CFDs involves significant risk and may not be suitable for all investors. Past performance is not indicative of future results.


