USDJPY Weakens Again as U.S. Economic Indicators Worsen Beyond Expectations【April 29, 2025】
Fundamental Analysis
Dallas Fed Manufacturing Index declines, worst level since May 2020
Market reacts to tariffs, leading to USD weakness in forex markets
USDJPY Technical Analysis
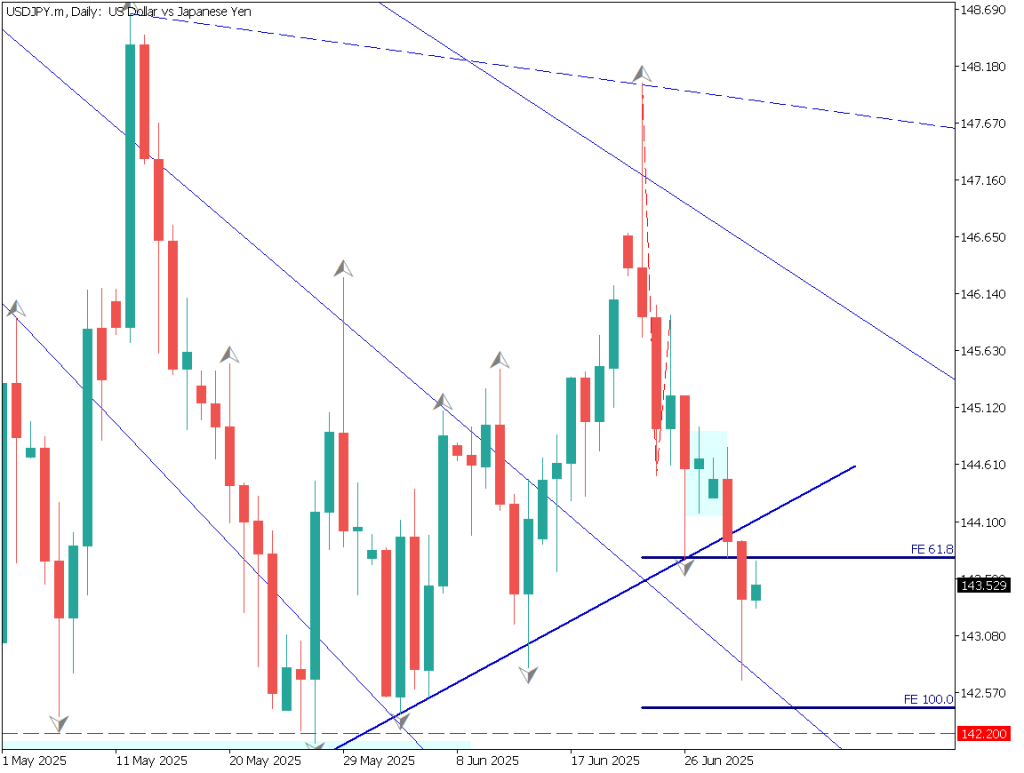
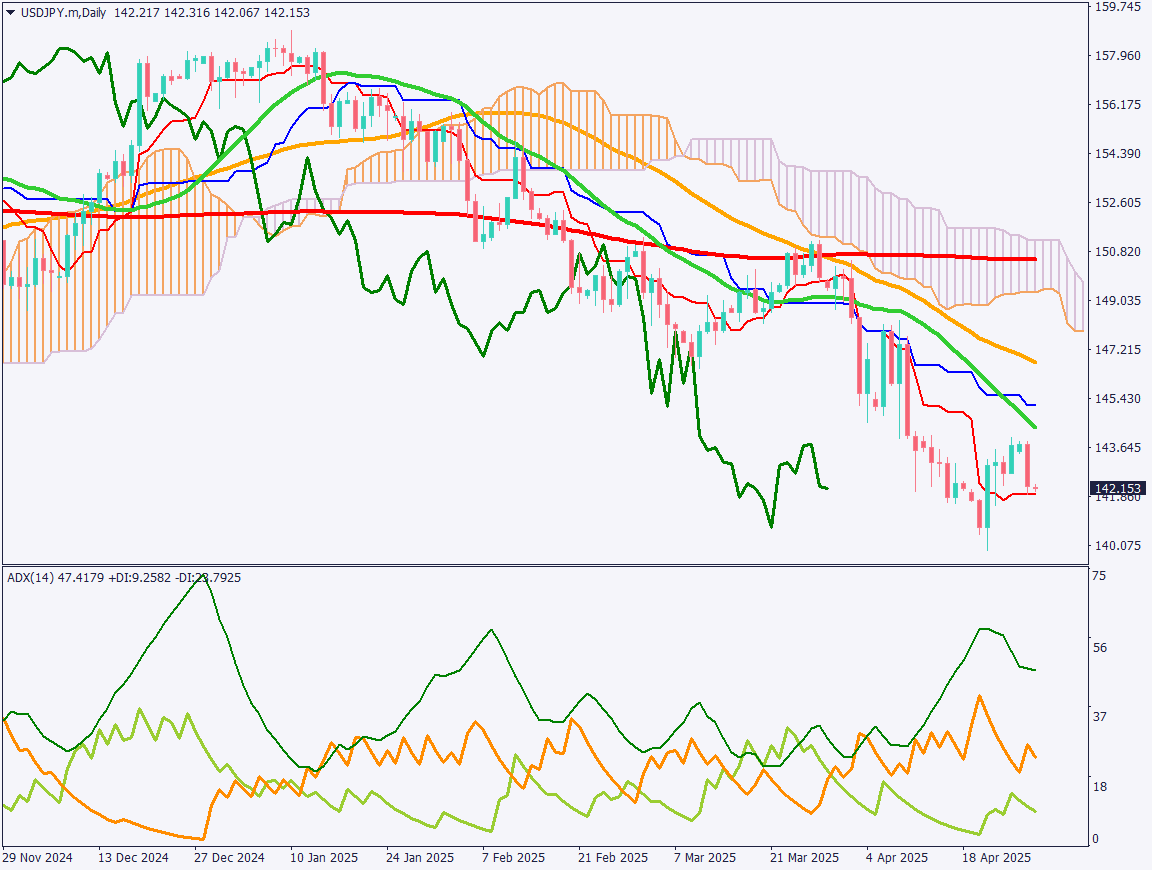
Analyzing the daily chart of USDJPY. USDJPY is declining, now trading in the 141JPY range. Recently, the price was hovering above the Conversion Line, but attention is now on whether it will break below it again. While the support at 140JPY remains firm, a break below recent lows could trigger stop-losses and accelerate the downtrend.
Due to the Golden Week holiday, unexpected market movements may occur. The projected downside target is around 139.89JPY. Traders should keep an eye on the Conversion Line and recent lows for trading strategies.
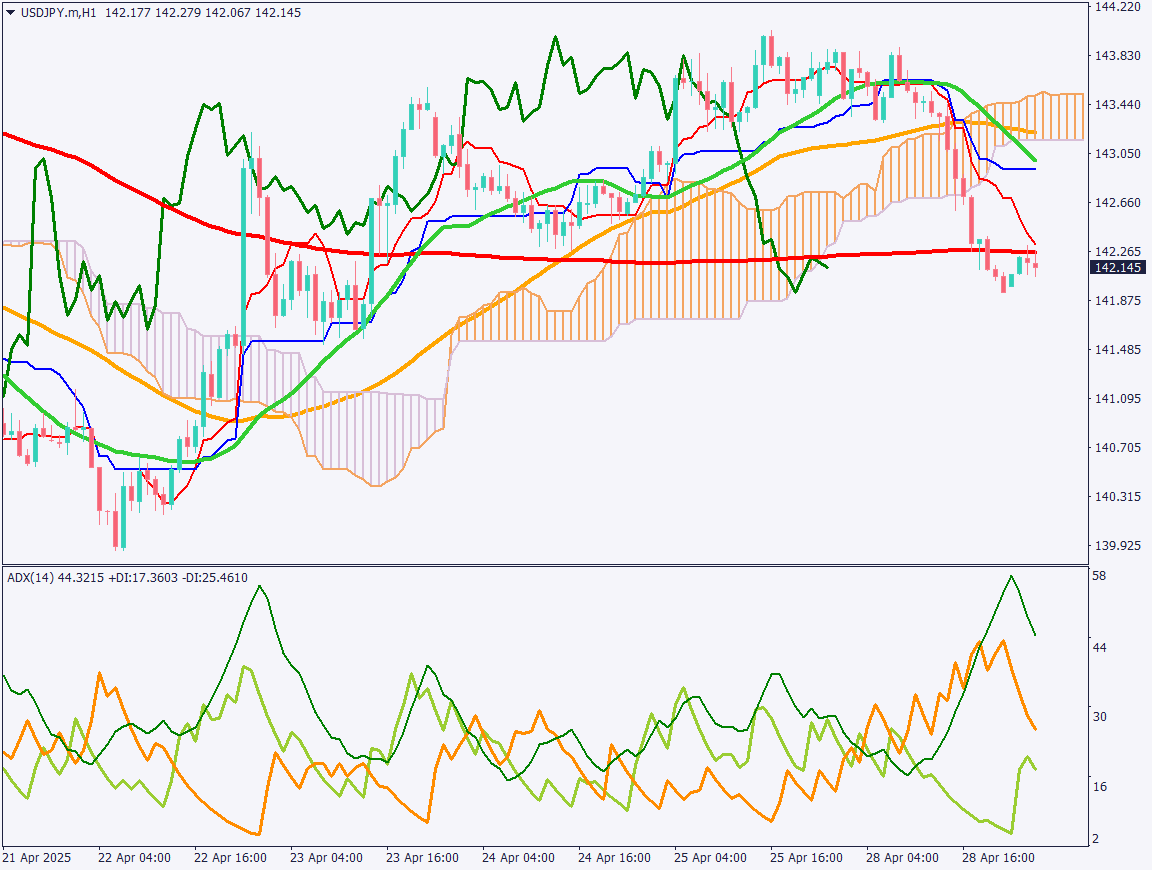
Day trading strategy (1 hour)
Analyzing the 1-hour chart of USDJPY. USDJPY has broken below the 200 Moving Average, and the 200MA has now shifted from support to resistance, suggesting heavy upside pressure.
The U.S. Dollar Index is also declining, pushing the overall market toward USD weakness. Market sentiment shows nearly 70% holding long positions, but if the downward momentum strengthens, it could trigger stop-losses and further declines.
Unless USDJPY clearly breaks above the 200MA, it is advisable to focus on short-selling strategies. As Japan has a public holiday today, trading in overseas markets is recommended.
Support/Resistance lines
Key support and resistance lines to consider:
146.35JPY – Major resistance level
142.72JPY – Major support level
Market Sentiment
USDJPY Sell: 31% / Buy: 69%
Today’s important economic indicators
Economic Indicators and EventsJapan TimeU.S. Consumer Confidence Index23:00U.S. JOLTS Job Openings23:00
*Trading advice in this article is not provided by Milton Markets, but by Shu Fujiyasu Jr., a certified technical analyst.
Risk Disclaimer
This analysis is for educational purposes only and does not constitute investment advice. Trading forex and CFDs involves significant risk and may not be suitable for all investors. Past performance is not indicative of future results.
This analysis is for educational purposes only and does not constitute investment advice. Trading forex and CFDs involves significant risk and may not be suitable for all investors. Past performance is not indicative of future results.