USD/JPY: Selling Pressure Dominates on Rallies

Daily Market Analysis
Expert analysis of today's market movements and trading opportunities
Daily Market Analysis
Expert analysis of today's market movements and trading opportunities
Fundamental Analysis
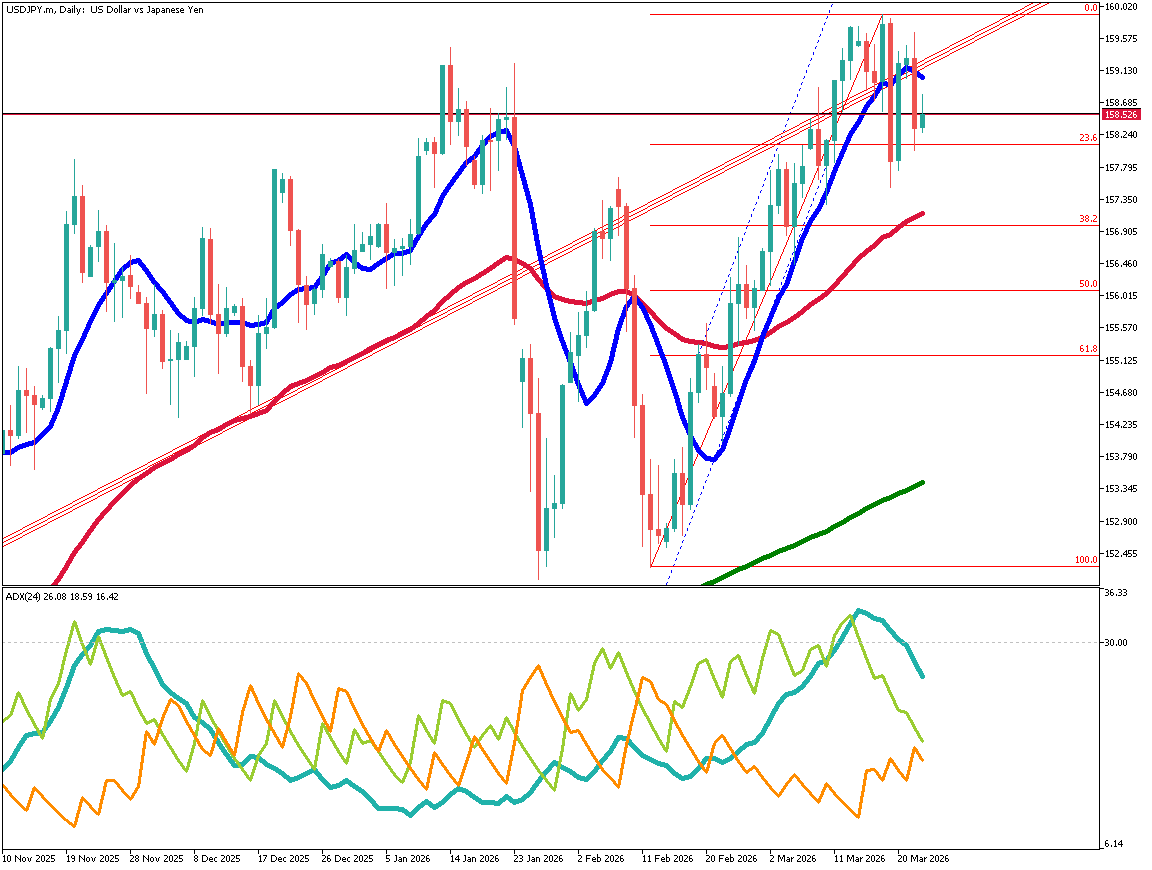
- USD/JPY is facing strong selling pressure on rebounds and is trading around the 155 level. The pair has fallen below short-, medium-, and long-term moving averages and is forming a lower high on the daily chart. It has also broken below the 50% Fibonacci level and the Ichimoku cloud, with bearish fractal signals appearing. Selling pressure has intensified, partly due to U.S. dollar weakness following China’s sale of U.S. Treasuries. With prices below the 52-day moving average and RSI under 50, a decline toward the 150 level is possible.
Fundamental Analysis
USD/JPY is currently in a phase where selling on rebounds dominates, with prices around the 155 level. The pair has fallen below short-, medium-, and long-term moving averages.
Forming a Lower High
USD/JPY is forming a lower high and is attempting to break below the 50% Fibonacci retracement level. It has already fallen below the 10-day moving average and the Ichimoku cloud. Bearish fractal signals have appeared, indicating increasing selling pressure.
One factor behind this move is stronger U.S. dollar selling after China sold U.S. Treasuries, which spilled over into USD/JPY. As explained in yesterday’s analyst video, selling on rebounds is expected to remain dominant.
Since the price is below the 52-day moving average, a possible scenario is a decline toward the 150 level. The RSI has fallen below 50 again, suggesting growing selling pressure.
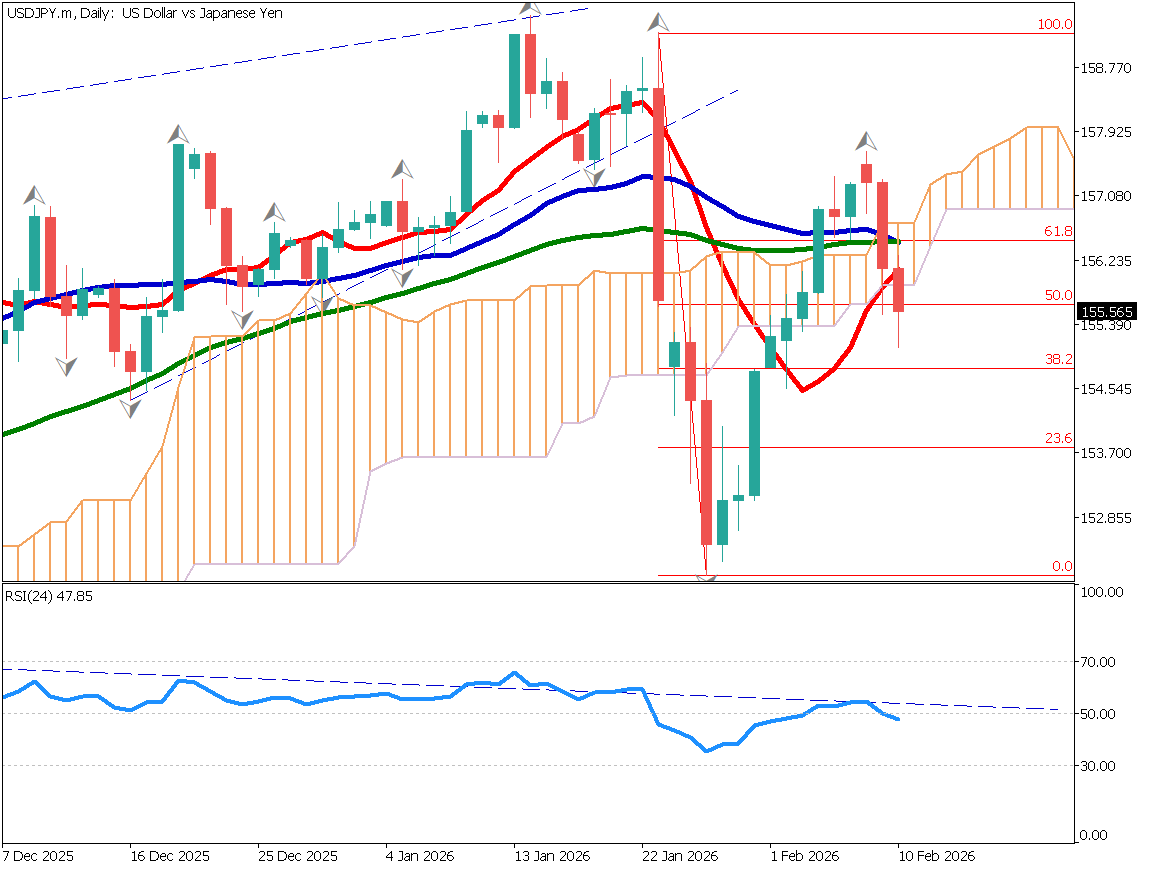
USD/JPY – Daily Chart
A downtrend has emerged. The moving averages are forming a bearish “perfect order,” aligned from long-term to short-term above the price. After breaking below the 50% level, attention is now on whether this level will act as resistance.
At least from a short-term perspective, the downtrend is expected to continue.
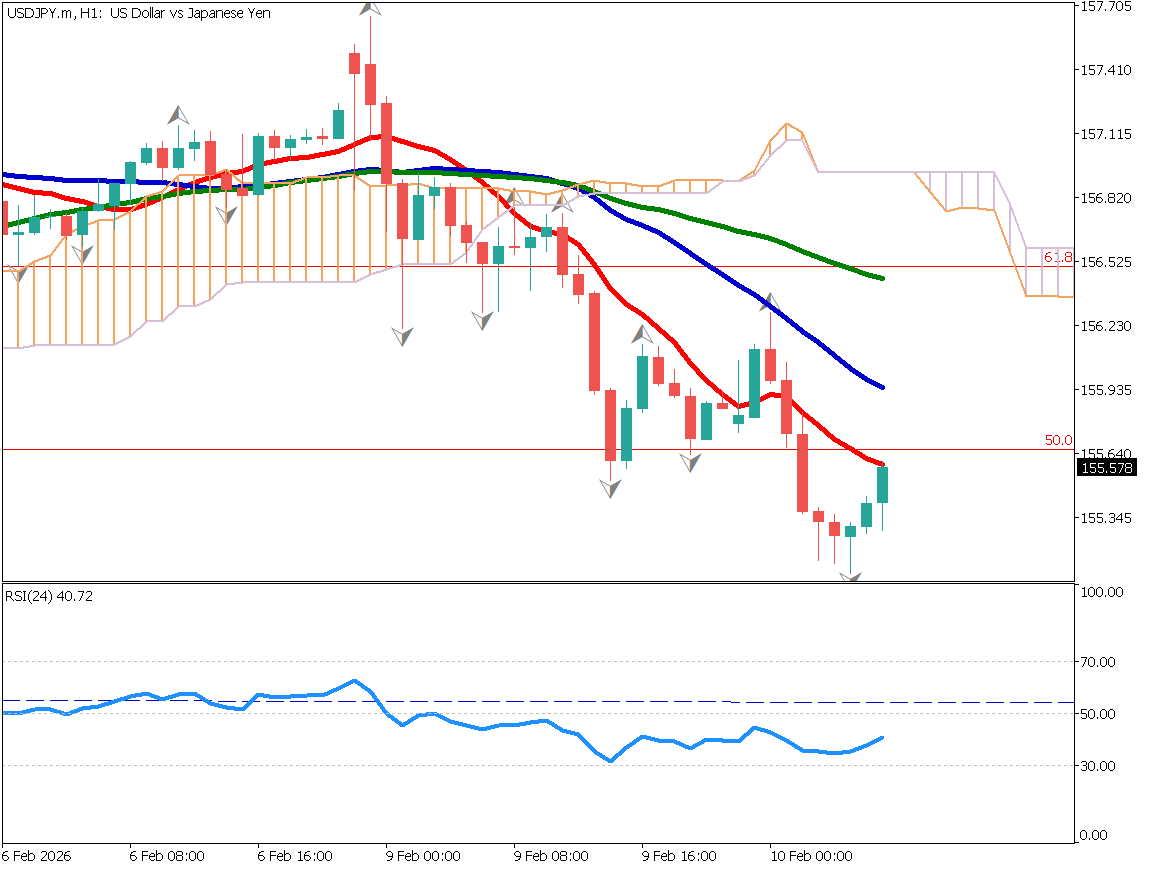
USD/JPY – 1-Hour Chart
Today’s Economic Indicator
22:30 (Japan time): U.S. Retail Sales (December)
Ready to trade?
Open live accountRelated Analysis
This material is for informational purposes only and does not constitute investment advice. Trading leveraged products involves significant risk of loss. Past performance is not indicative of future results.