USD/JPY Breaks Out of Range Market!

Daily Market Analysis
Expert analysis of today's market movements and trading opportunities
Daily Market Analysis
Expert analysis of today's market movements and trading opportunities
Fundamental Analysis
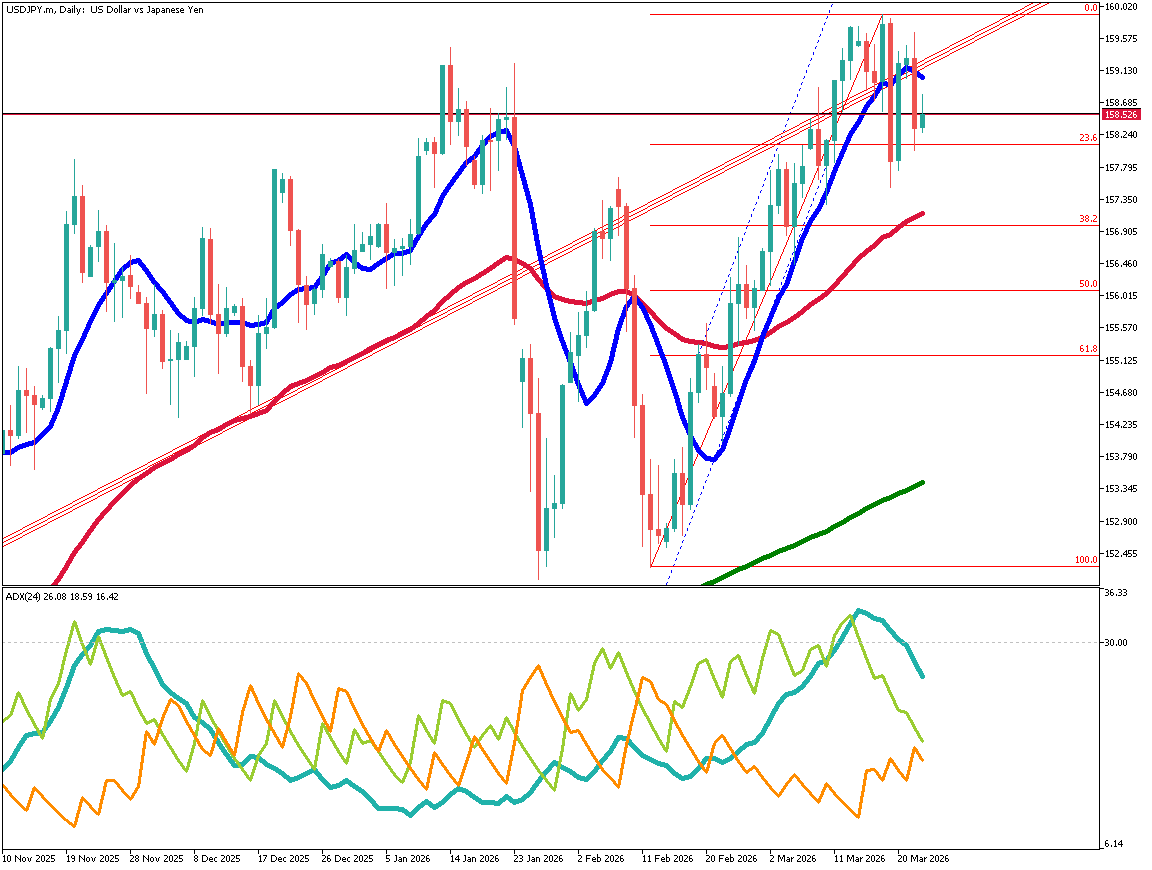
- USD/JPY broke above the long-term range top at 154 and rose into the 155 level. The 200-day EMA acted as support, favoring buy-on-dip strategies. However, RSI has not fully confirmed a bullish trend, leaving room for pullbacks. A break above the Kijun-sen around 155.660 could open the way toward the 157 area.
Fundamental Analysis
The New York Fed’s USD/JPY rate check was revealed to be directed by the U.S. Treasury.
Reports suggest ECB President Lagarde may step down early, creating uncertainty within EU nations.
U.S. housing starts rose 6.2%, exceeding expectations and marking the highest level since July last year.
Forming a Double Bottom?
USD/JPY had been trading within a long-term range. During the New York session yesterday, price broke above the range high and climbed into the 155 level, surpassing the key resistance at 154. As explained in yesterday’s video, the 200-day EMA functioned as support and triggered a rebound.
Price moved above the Ichimoku conversion line and reached the 52-day EMA. The Ichimoku base line is currently around 155.660, which will be the key level to watch. However, RSI remains at 49, meaning momentum has not yet fully shifted to a bullish trend. The possibility of renewed selling pressure still remains.
While maintaining caution, buying on dips may be reasonable until price reaches the base line. If the base line is broken upward, the 157 level could come into view.
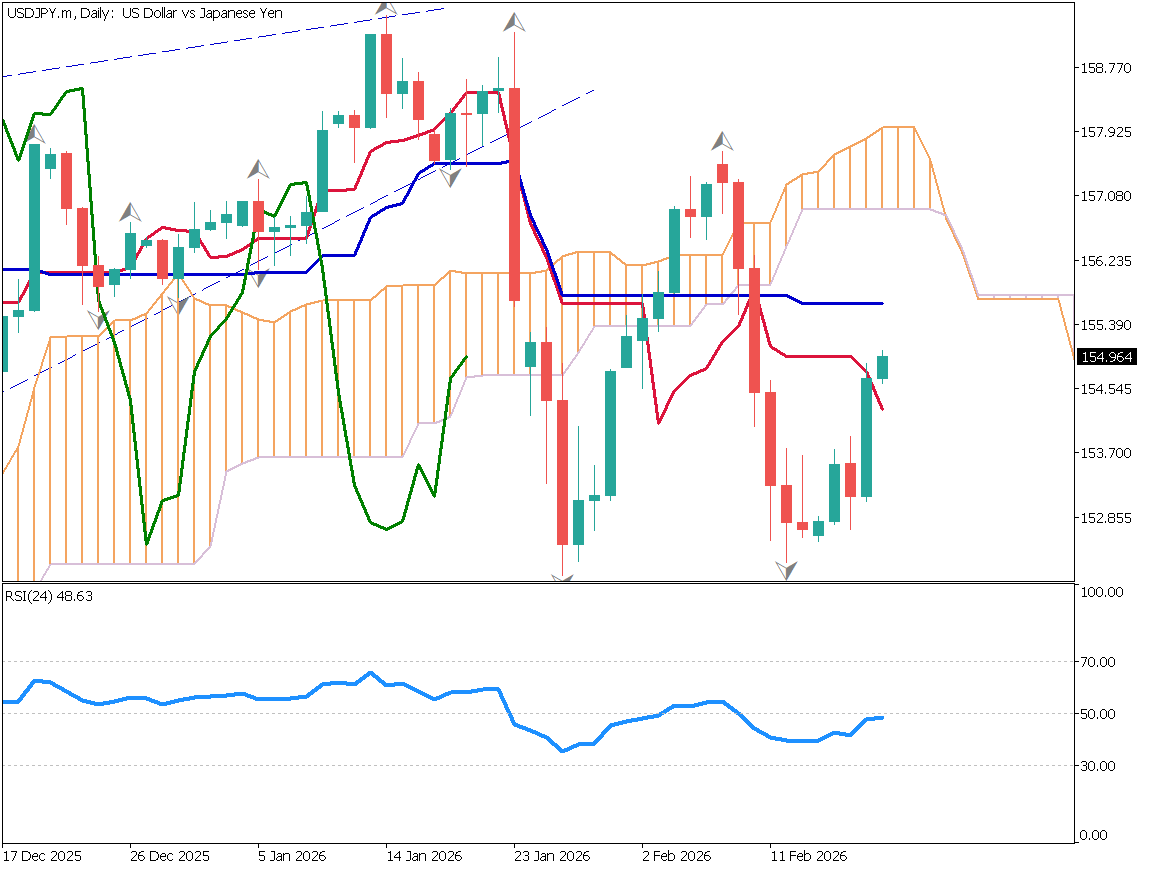
[USD/JPY – Daily Chart]
Breakout of the Range
On the 1-hour chart, the conversion line is acting as support. As long as price stays above it, the upward trend is likely to continue. However, RSI has reached 70, increasing the probability of a short-term pullback. Traders should monitor closely and be ready to exit quickly if a trend reversal occurs.
With the breakout from the range, upward momentum may strengthen again. The strategy is to look for buy-on-dip opportunities while assuming continued upside toward 155.660.
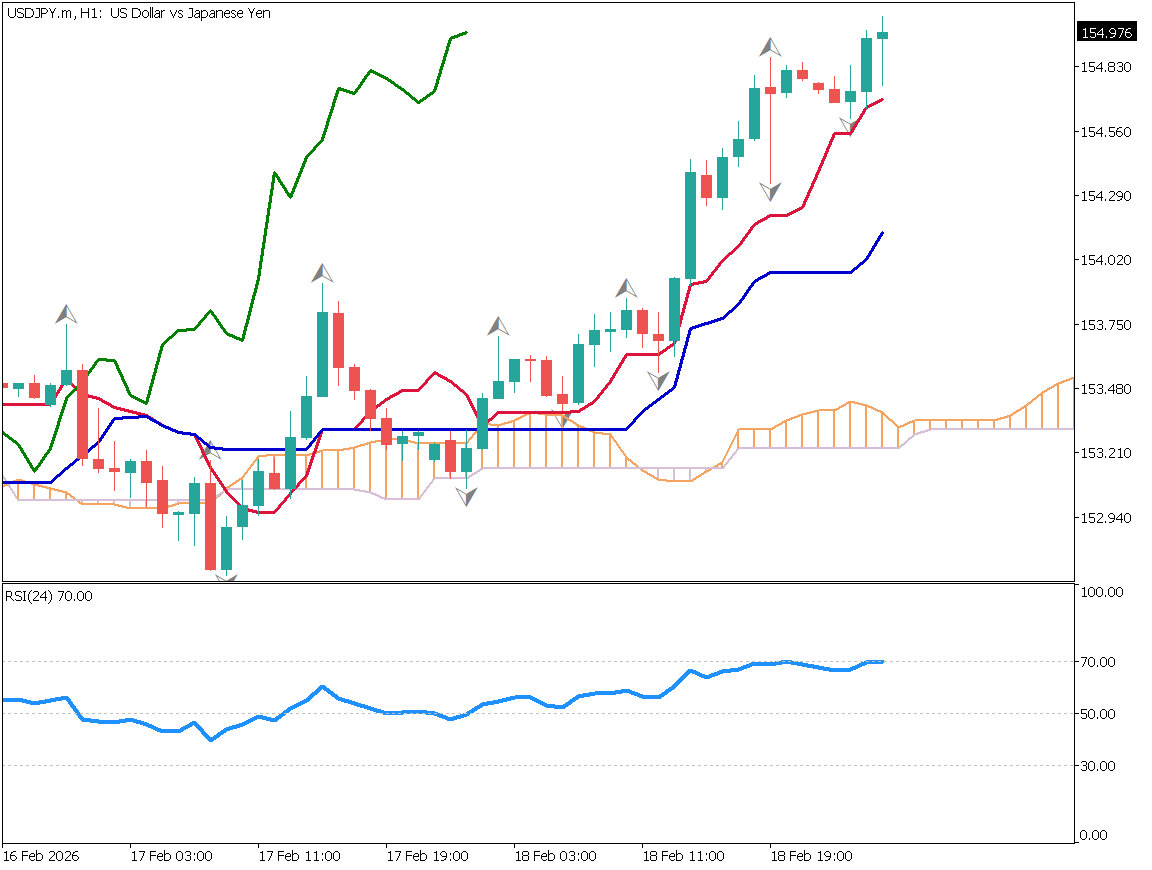
[USD/JPY – 1-Hour Chart]
Today’s Economic Indicators
9:30 JST — Australia Employment Data (January)
22:30 JST — U.S. Philadelphia Fed Manufacturing Index (February)
22:30 JST — U.S. Initial Jobless Claims
22:30 JST — U.S. Trade Balance (December)
24:00 JST — U.S. Pending Home Sales (January)
Ready to trade?
Open live accountRelated Analysis
This material is for informational purposes only and does not constitute investment advice. Trading leveraged products involves significant risk of loss. Past performance is not indicative of future results.