Gold Falls Below $4,000 as Risk-Off Sentiment Eases

Daily Market Analysis
Expert analysis of today's market movements and trading opportunities
Daily Market Analysis
Expert analysis of today's market movements and trading opportunities
Fundamental Analysis
- At the U.S.–China summit, both leaders reached an agreement on a new trade framework
- Risk-off sentiment eased; however, confusion surrounding the U.S. government shutdown continues
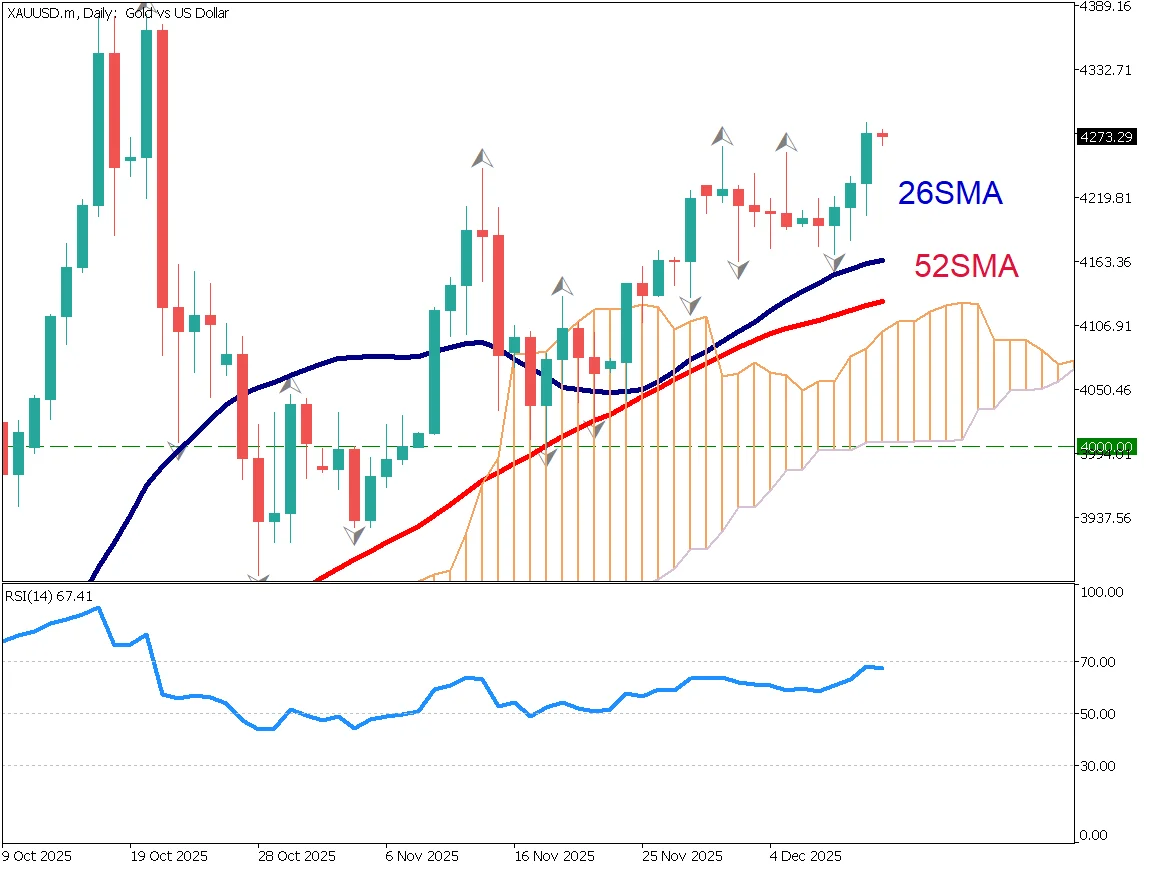
Gold Declines Below Baseline
Gold declined below the baseline, briefly dipping under $4,000. While tensions between the U.S. and China had previously fueled safe-haven demand, the latest agreement prompted a wave of profit-taking. Since October 2023, gold had surged over $1,000 in just three months, suggesting the current movement is a natural correction within an overheated market.
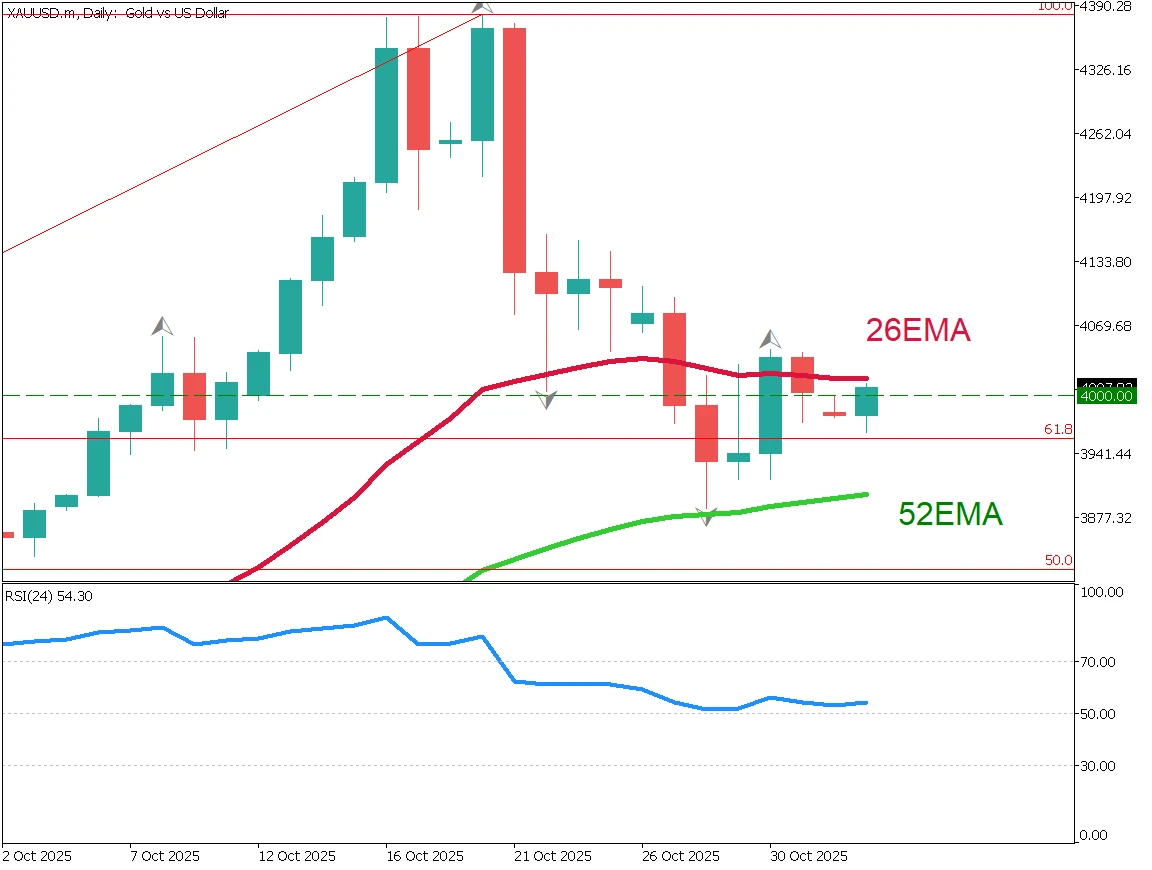
Buying interest remains solid, but key technical support levels can be found near the Fibonacci 61.8% retracement at $3,955, the 52-EMA around $3,880, and the 50% retracement near $3,825. Although trade risks have eased, factors such as geopolitical uncertainty, dollar weakness, and the ongoing U.S. government shutdown continue to support gold demand. Traders are watching closely to see where the next buying opportunity emerges.

[Gold / 1-Hour Chart] — Pro Strategy
The short-term trend remains bearish, with $4,155 marking the recent high. The price is testing lower lows, and stop losses around the $4,000 area could accelerate the decline. RSI also signals further downside potential.
A possible strategy is to set buy limits near $3,950 in anticipation of a rebound, or consider a short trade toward $3,950 with a stop above $4,000. Given the uncertain conditions, cautious trading is advised.

Key Economic Indicators (Subject to Delay)
Due to the U.S. government shutdown, data releases may be postponed.
| Time (JST) | Indicator |
|---|---|
| 22:00 | U.S. Case-Shiller Home Price Index |
| 23:00 | Richmond Fed Manufacturing Index |
Ready to trade?
Open live accountRelated Analysis
Gold Rises Further as U.S. Rate Cuts Accelerate
U.S. interest rate cuts continue to support gold prices. A rare "cup with handle" pattern has appeared on the gold chart, suggesting potential for further gains toward $4,400.
Can Gold Maintain the $4,000 Level?
Federal Reserve Governor Waller advocated for a rate cut in December, citing a weakening labor market. In Japan, despite the holiday, the yen continues to weaken gradually.
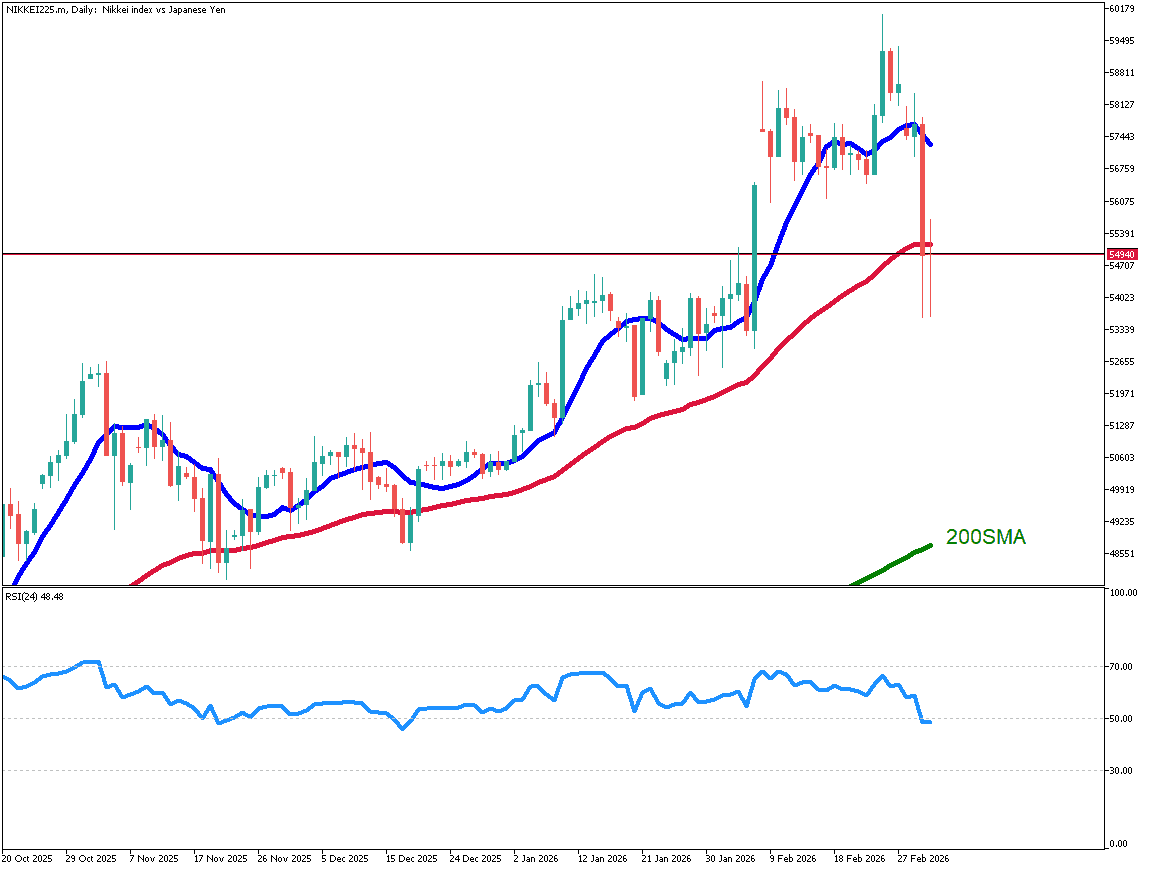
Nikkei Stock Average Plunges for Consecutive Days, Down 5,000 Yen
This material is for informational purposes only and does not constitute investment advice. Trading leveraged products involves significant risk of loss. Past performance is not indicative of future results.