Gold Declines as Market Optimism Fades

Daily Market Analysis
Expert analysis of today's market movements and trading opportunities
Daily Market Analysis
Expert analysis of today's market movements and trading opportunities
Fundamental Analysis
- U.S. stocks extended their losses, and the positive sentiment in the market has disappeared
- Gold is also lacking strong catalysts, and the Federal Reserve's hawkish stance is adding downward pressure
Market Optimism Fades
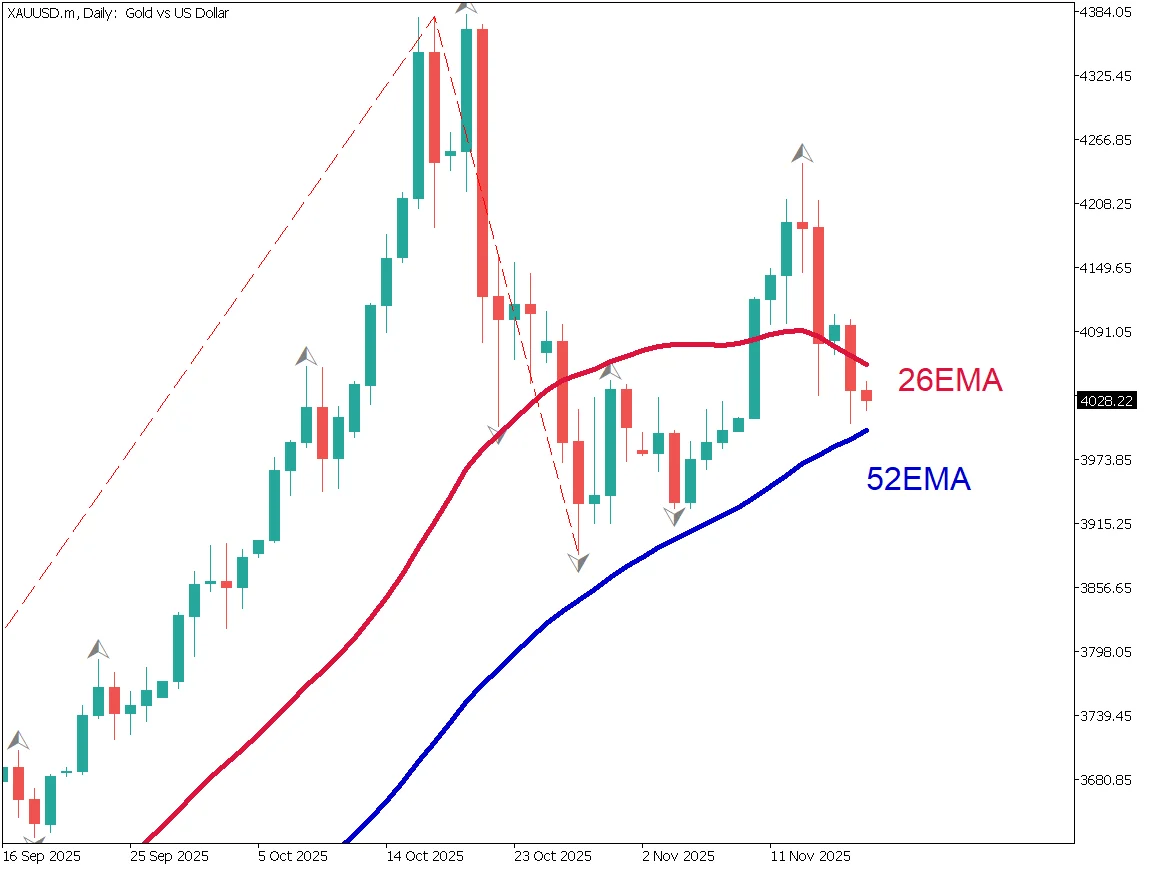
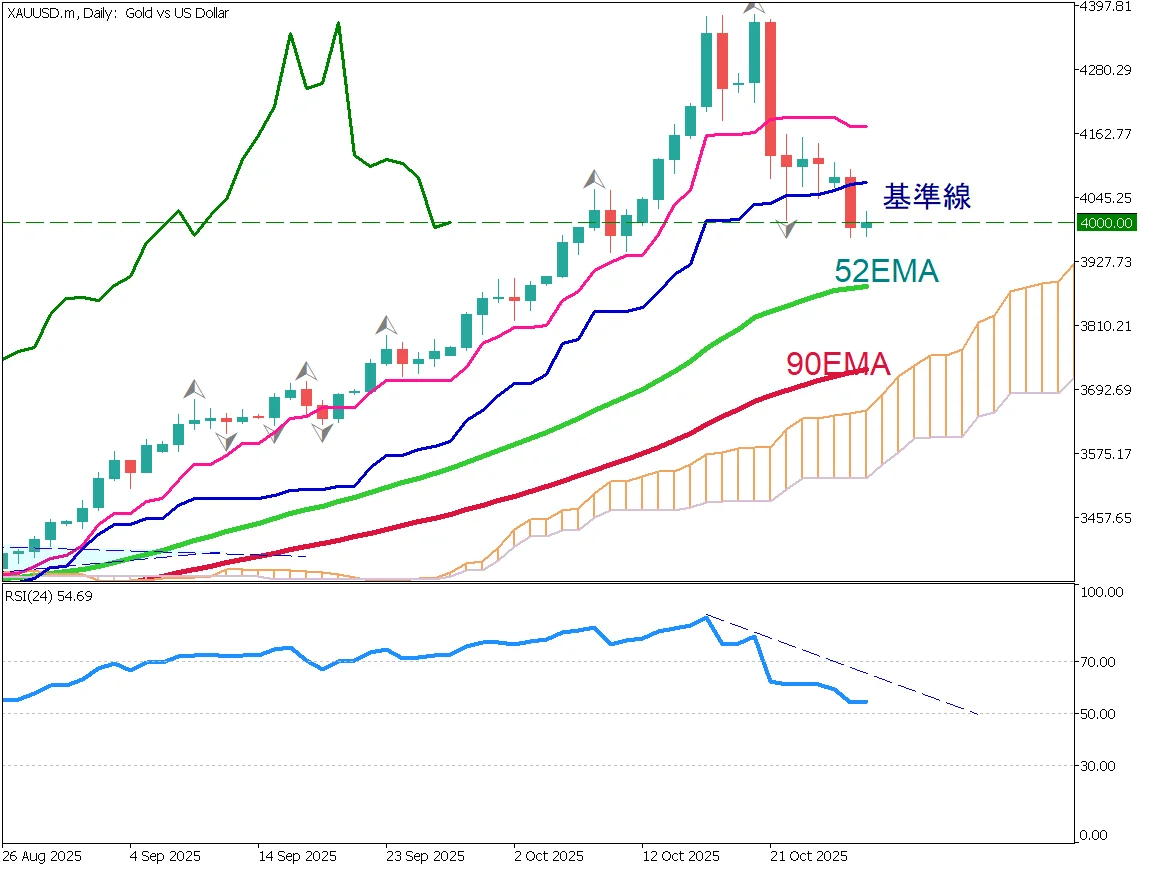
Gold briefly rose to $4,200 but soon lost momentum. The 26 EMA and 52 EMA are moving closer together, signaling weakening upward strength. Although gold formed a double bottom around $3,900, it failed to break above recent highs and has since pulled back.
The key focus now is whether the 52 EMA will act as a support line.
Behind this move is a series of hawkish comments from Fed officials, which has lowered expectations for a December rate cut. Reduced expectations for rate cuts strengthen the U.S. dollar, which is bearish for gold.
It remains a difficult judgment, but market participants will closely watch whether gold can maintain $4,000 and hold above the 52 EMA.
Gold Day Trade Strategy
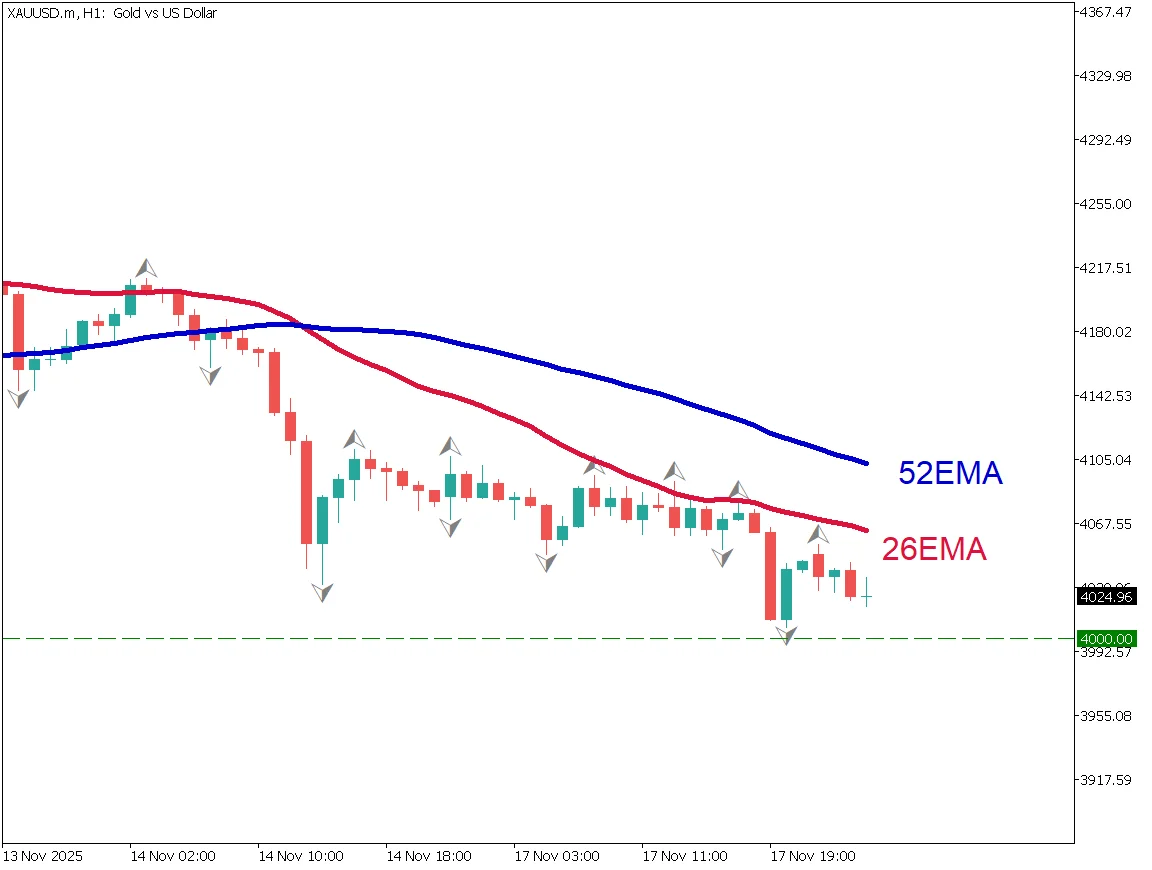
On the 1-hour chart, gold is in a mild downward trend. It is not a strong downtrend, but prices continue to gradually make lower lows. The $4,000 level appears to be a solid support. Moving forward, the 26 EMA is expected to cap the upside as gold approaches the $4,000 zone. Traders should watch whether the 26 EMA continues to function as a resistance line.
A long-term downtrend is not expected at this stage, but gold may test the low $3,900 range again. The strategy is to wait for deeper pullbacks and look for buying opportunities.
Today's Key Economic Indicators
Note: Due to the U.S. government shutdown, economic releases may be delayed.
| Indicator / Event | Time |
|---|---|
| U.S. Factory Orders (August) | 24:00 |
Ready to trade?
Open live accountRelated Analysis
Gold Rises Further as U.S. Rate Cuts Accelerate
U.S. interest rate cuts continue to support gold prices. A rare "cup with handle" pattern has appeared on the gold chart, suggesting potential for further gains toward $4,400.
Can Gold Maintain the $4,000 Level?
Federal Reserve Governor Waller advocated for a rate cut in December, citing a weakening labor market. In Japan, despite the holiday, the yen continues to weaken gradually.
Gold Falls Below $4,000 as Risk-Off Sentiment Eases
Gold briefly fell below $4,000 as risk-off sentiment eased after the U.S.–China trade agreement. The metal is correcting after a sharp rally, with potential support near $3,955 and $3,880.
This material is for informational purposes only and does not constitute investment advice. Trading leveraged products involves significant risk of loss. Past performance is not indicative of future results.