Gold Forms a Consolidation Triangle

Daily Market Analysis
Expert analysis of today's market movements and trading opportunities
Daily Market Analysis
Expert analysis of today's market movements and trading opportunities
Fundamental Analysis
- Although diplomatic friction continues between Japan and China, the impact on the market appears limited
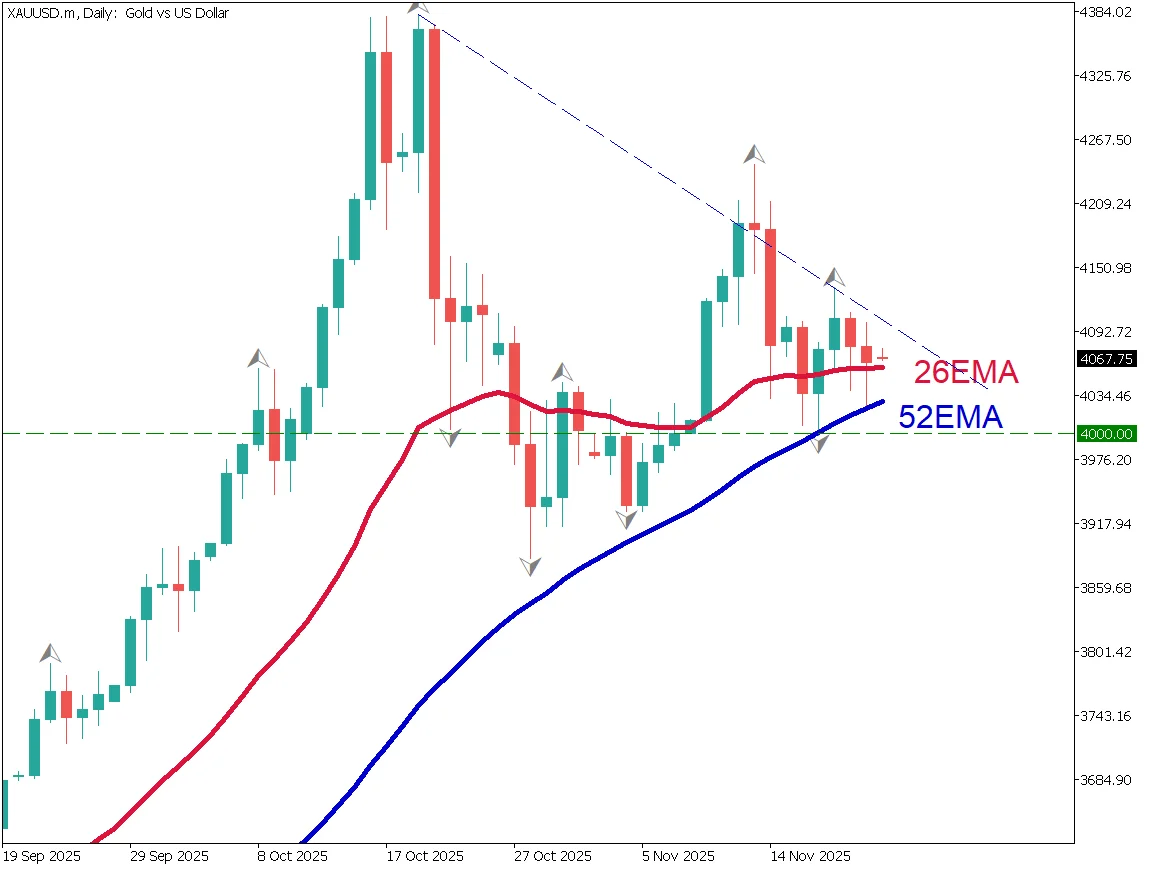
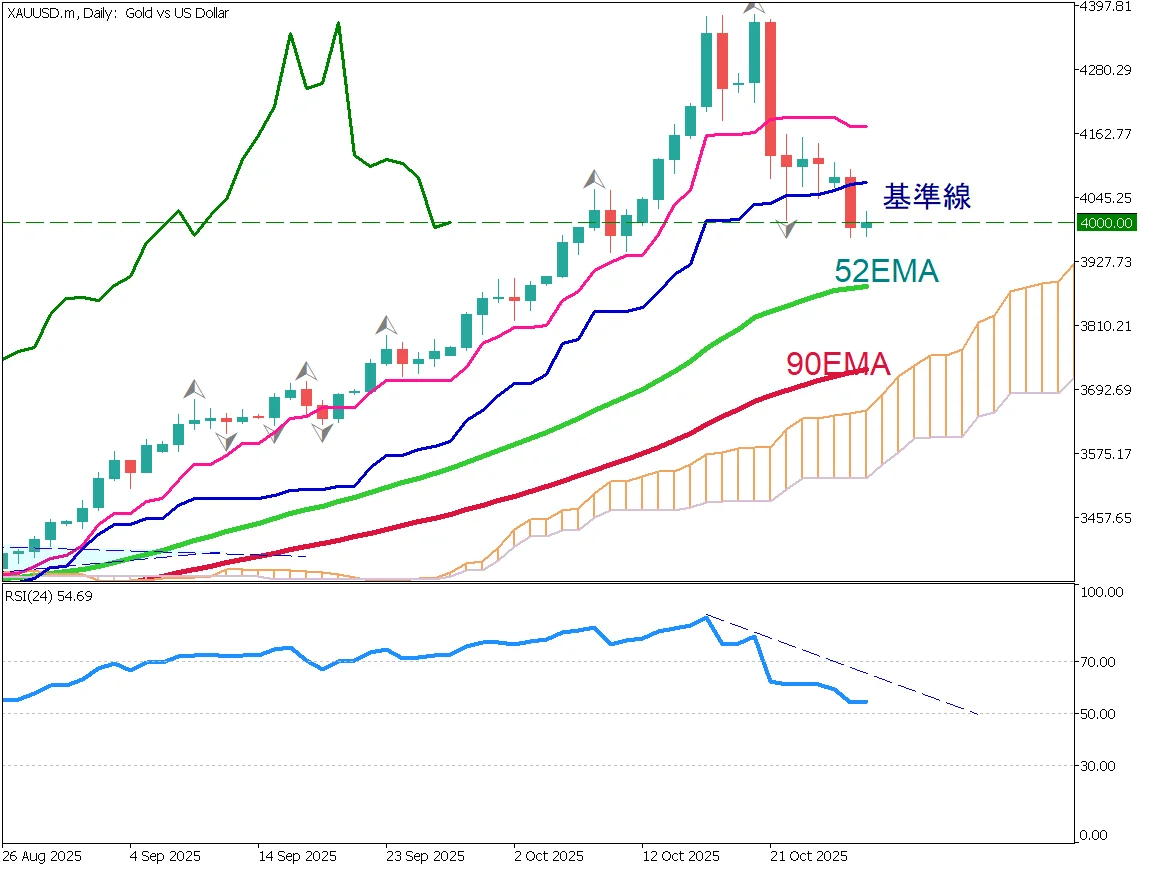
- Gold is still searching for direction as it forms a triangular consolidation pattern
Forming a Triangle
Gold has been making lower highs while higher lows remain supported by the 52EMA. The 26EMA also acts as a support line, leaving the market without a clear trend. The Fed has shown a cautious stance toward rate cuts, creating a bearish factor for gold. The market is not fully convinced that the Fed will cut rates at the December FOMC, which adds to the lack of direction.
The $4,000 level is a key support area, and whether gold can hold above it will be crucial. Eventually, the market is expected to break out either upward or downward. For now, staying on the sidelines may be wise.
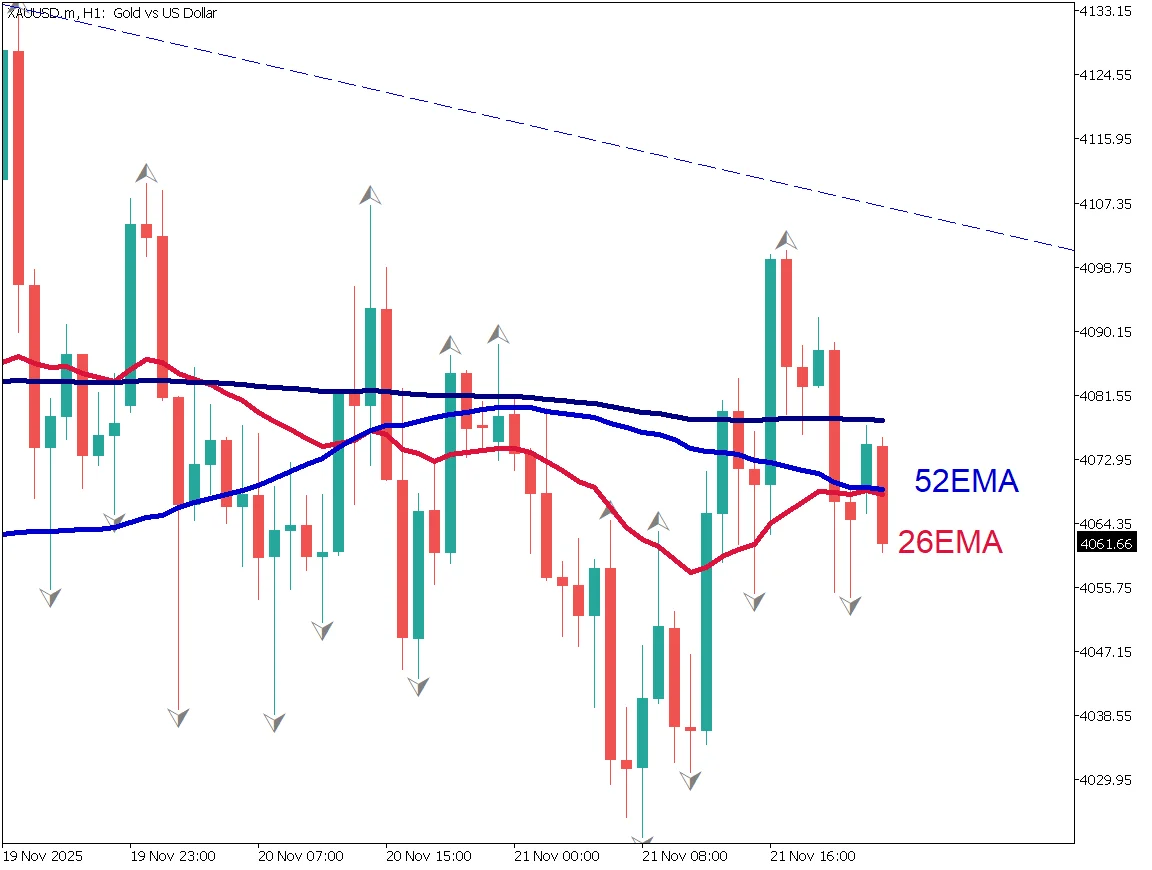
Gold Day-Trade Strategy
On the 1-hour chart, gold continues to range between $4,000 and $4,100, though the upper side is gradually becoming heavier. The moving averages also show no clear trend.
Expectations for rate cuts have weakened, strengthening the dollar, but buying interest in gold continues to provide underlying support. Notably, multiple fractals appear near $4,000, indicating steady buying activity.
A pullback-based long entry could be considered.
Today's Key Events
Note: Due to the U.S. government shutdown, U.S. economic data releases may be delayed.
| Event | Time |
|---|---|
| ECB President Lagarde Speech | 23:45 |
Ready to trade?
Open live accountRelated Analysis
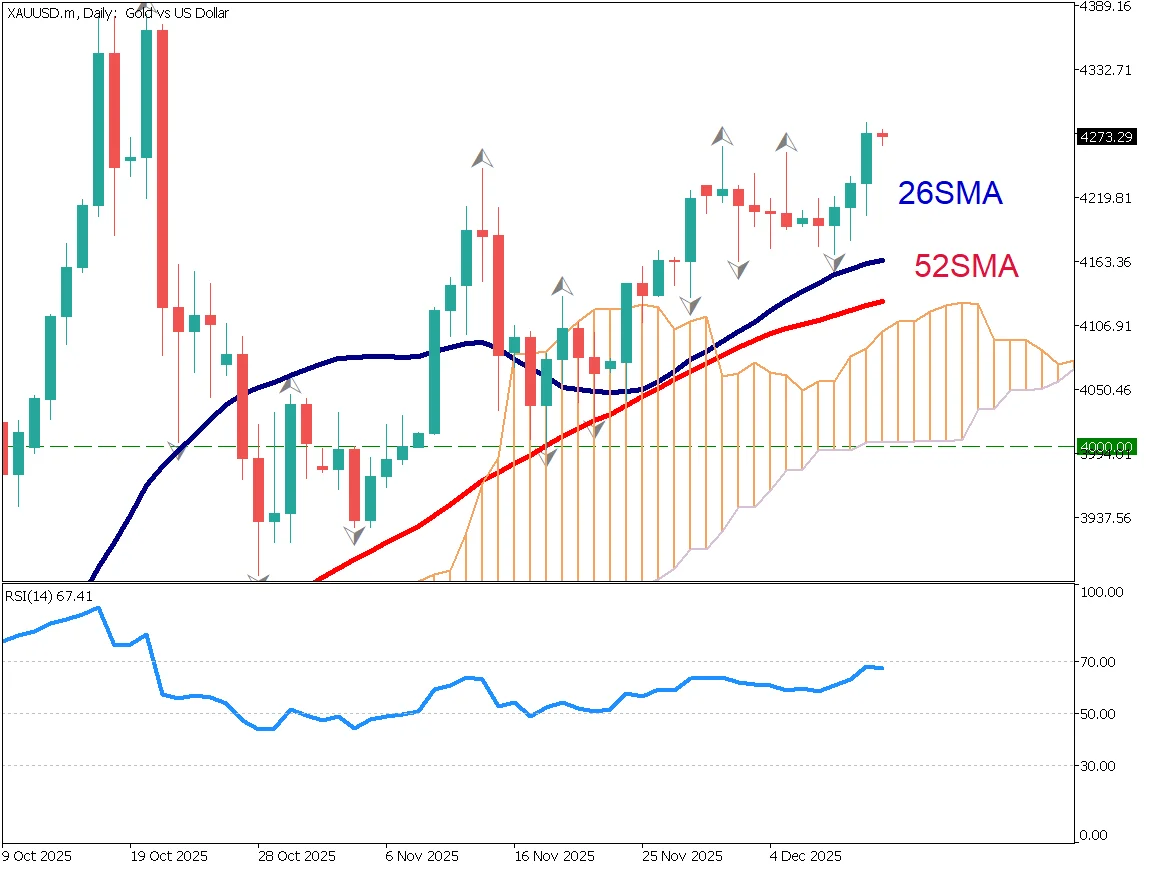
Gold Rises Further as U.S. Rate Cuts Accelerate
U.S. interest rate cuts continue to support gold prices. A rare "cup with handle" pattern has appeared on the gold chart, suggesting potential for further gains toward $4,400.
Can Gold Maintain the $4,000 Level?
Federal Reserve Governor Waller advocated for a rate cut in December, citing a weakening labor market. In Japan, despite the holiday, the yen continues to weaken gradually.
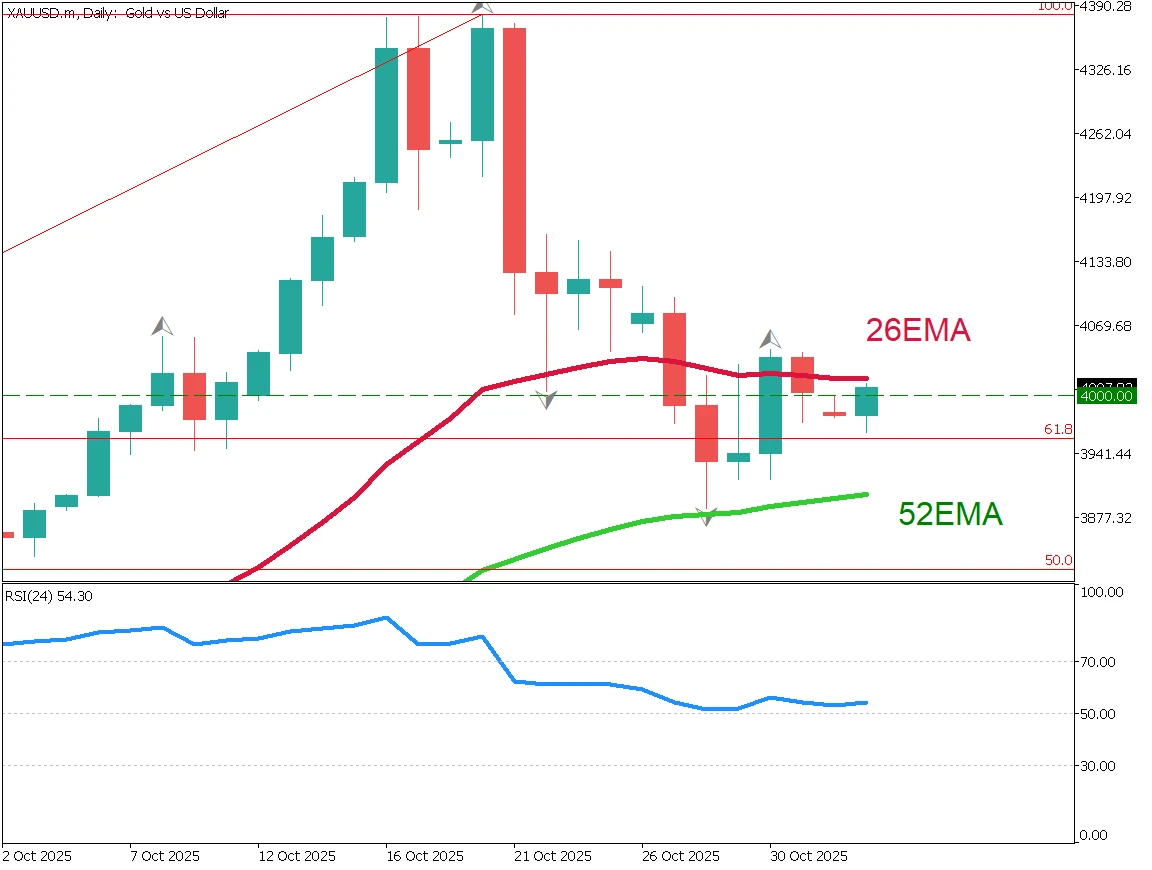
Gold Falls Below $4,000 as Risk-Off Sentiment Eases
Gold briefly fell below $4,000 as risk-off sentiment eased after the U.S.–China trade agreement. The metal is correcting after a sharp rally, with potential support near $3,955 and $3,880.
This material is for informational purposes only and does not constitute investment advice. Trading leveraged products involves significant risk of loss. Past performance is not indicative of future results.