Can Gold Maintain the $4,000 Level?

Daily Market Analysis
Expert analysis of today's market movements and trading opportunities
Daily Market Analysis
Expert analysis of today's market movements and trading opportunities
Summary of Key Events
- Federal Reserve Governor Waller advocated for a rate cut in December, citing a weakening labor market.
- In Japan, despite the holiday, the yen continues to weaken gradually.
Gold Daily Chart Analysis
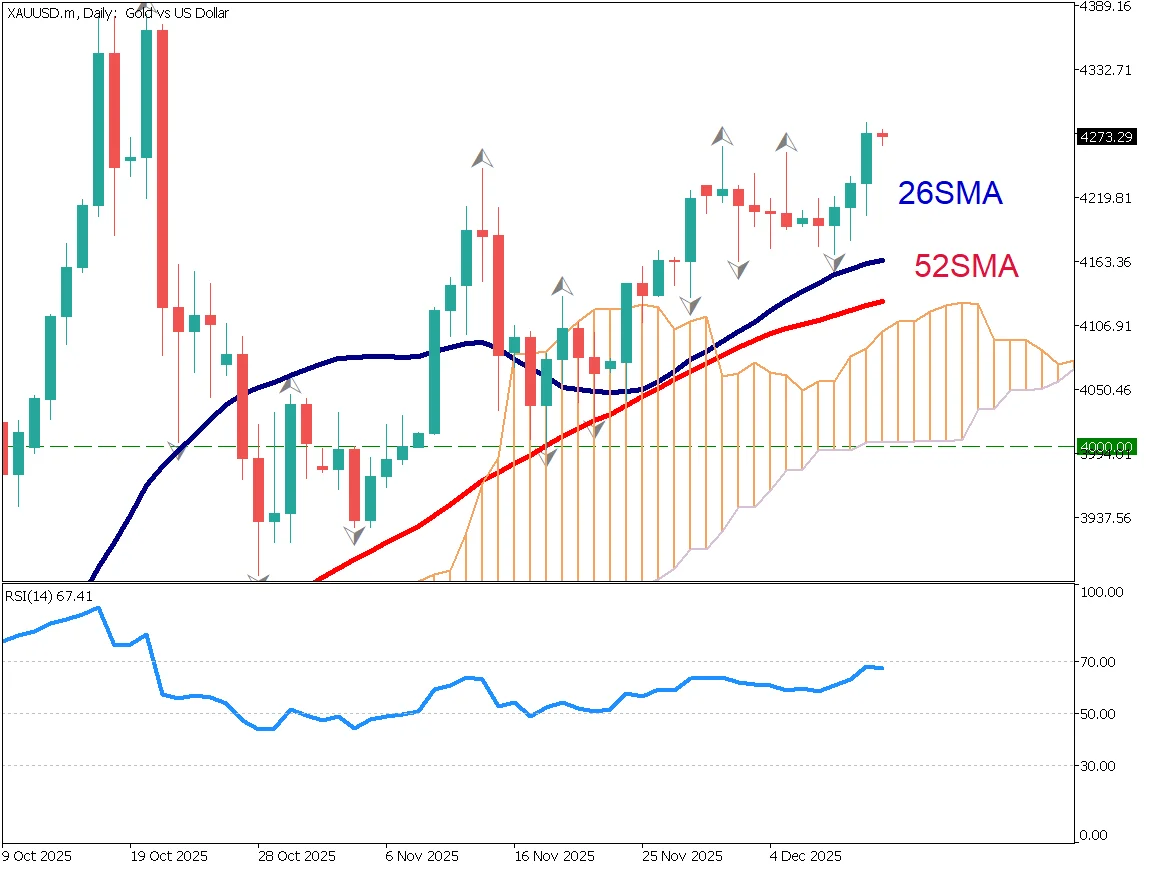
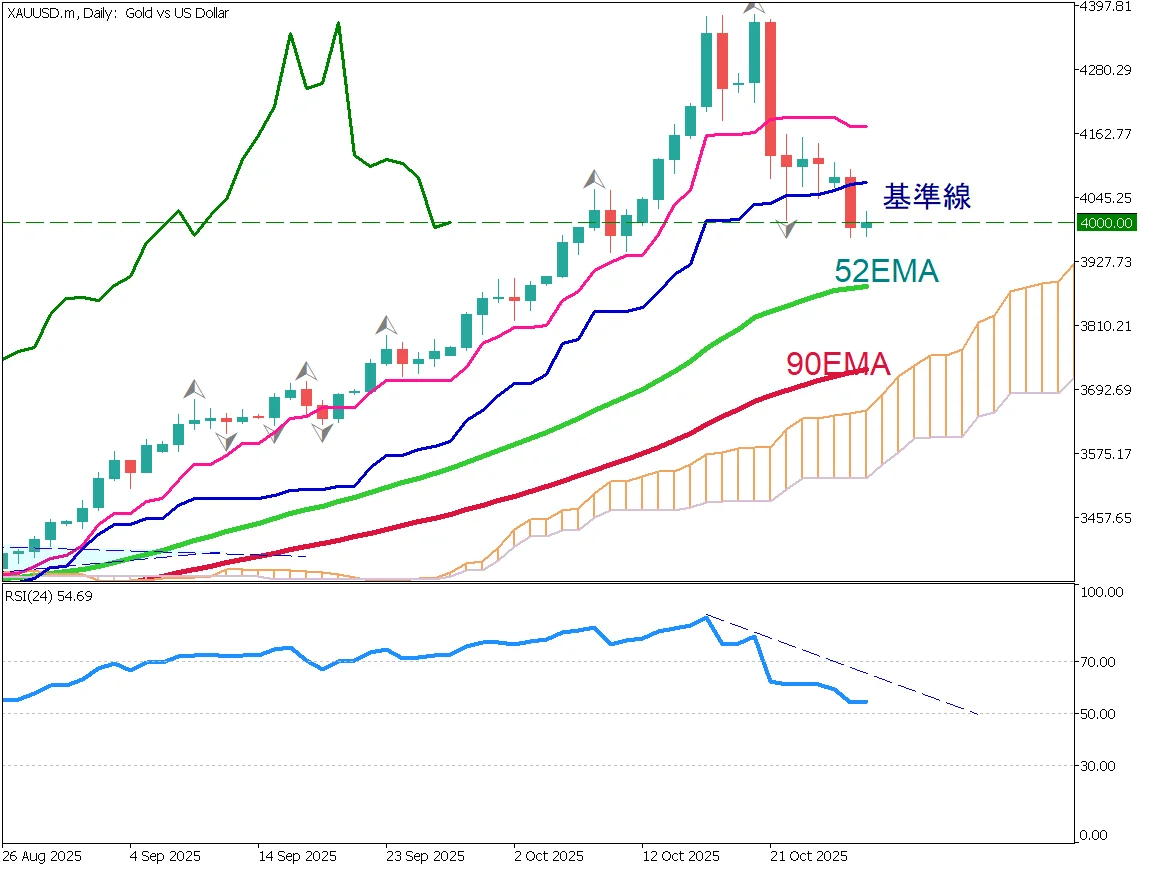
Gold has rebounded from the 52-day EMA but faces resistance at the 26-day EMA, keeping prices in a consolidation phase around $4,000. This level has become the center of a range, and the ability to hold above $4,000 will be a key focus. The 61.8% Fibonacci retracement is providing support. If new catalysts emerge and demand for gold rises, a breakout could occur. After a period of sharp rallies, gold is showing signs of stabilization.
Traders should watch whether the RSI falls below 50 — buying on dips remains a favorable approach.

Gold Day-Trade Strategy
The 26EMA remains a resistance line, while higher lows suggest a mild upward trend. Gold appears to be forming a range centered around $4,000, though the market currently lacks a clear direction. Limited movement is expected before the European and U.S. sessions open.
A buy-limit order near the low $3,900 range may be considered.

Key Economic Data Today
Note: U.S. data releases may be delayed due to the ongoing government shutdown.
| Indicator | Time (JST) |
|---|---|
| U.S. PMI | 23:45 |
Ready to trade?
Open live accountRelated Analysis
Gold Rises Further as U.S. Rate Cuts Accelerate
U.S. interest rate cuts continue to support gold prices. A rare "cup with handle" pattern has appeared on the gold chart, suggesting potential for further gains toward $4,400.
Gold Falls Below $4,000 as Risk-Off Sentiment Eases
Gold briefly fell below $4,000 as risk-off sentiment eased after the U.S.–China trade agreement. The metal is correcting after a sharp rally, with potential support near $3,955 and $3,880.
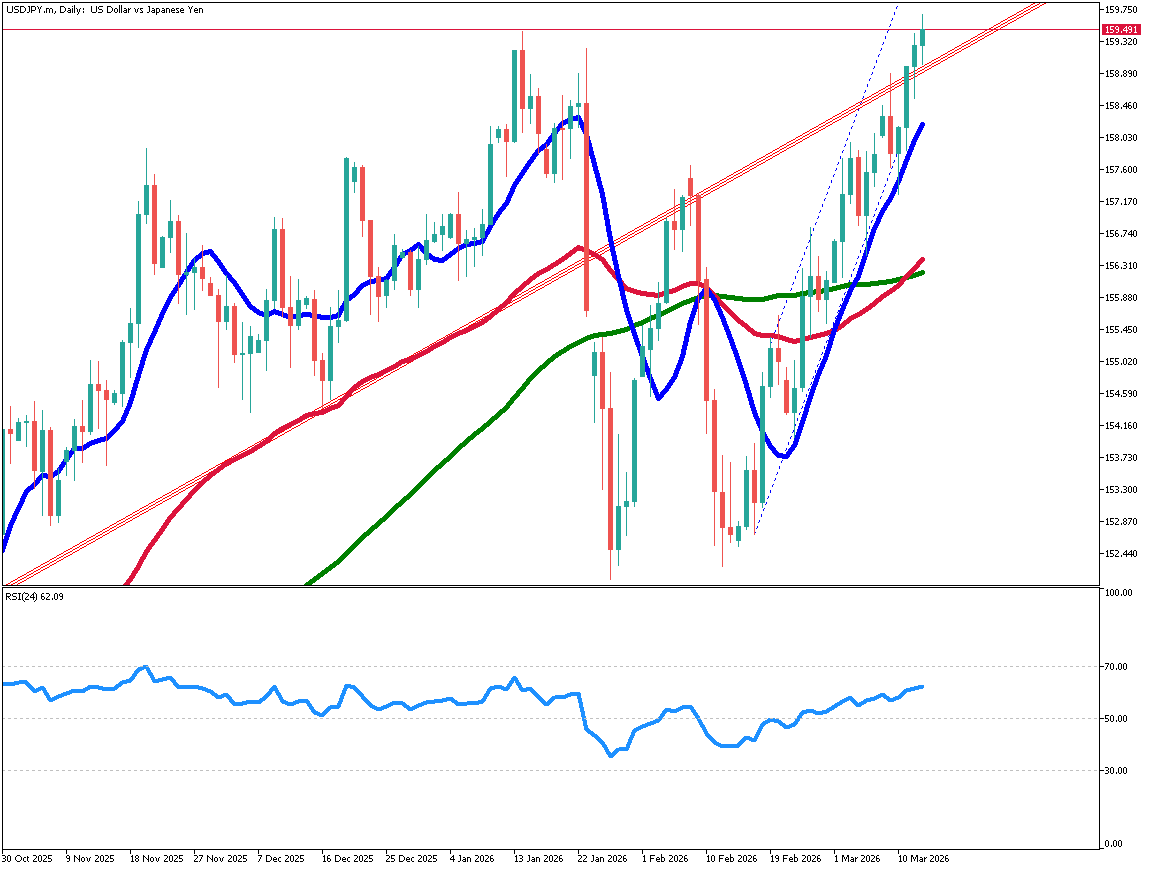
USD/JPY Aims to Break 160 Yen: When Will Surging Oil Prices Settle?
This material is for informational purposes only and does not constitute investment advice. Trading leveraged products involves significant risk of loss. Past performance is not indicative of future results.