Gold Regains a Mild Uptrend

Daily Market Analysis
Expert analysis of today's market movements and trading opportunities
Daily Market Analysis
Expert analysis of today's market movements and trading opportunities
Fundamental Analysis
- The ECB minutes suggested that policymakers are in no hurry to cut rates
- Bitcoin recovered to 90,000 dollars after briefly falling below 80,000
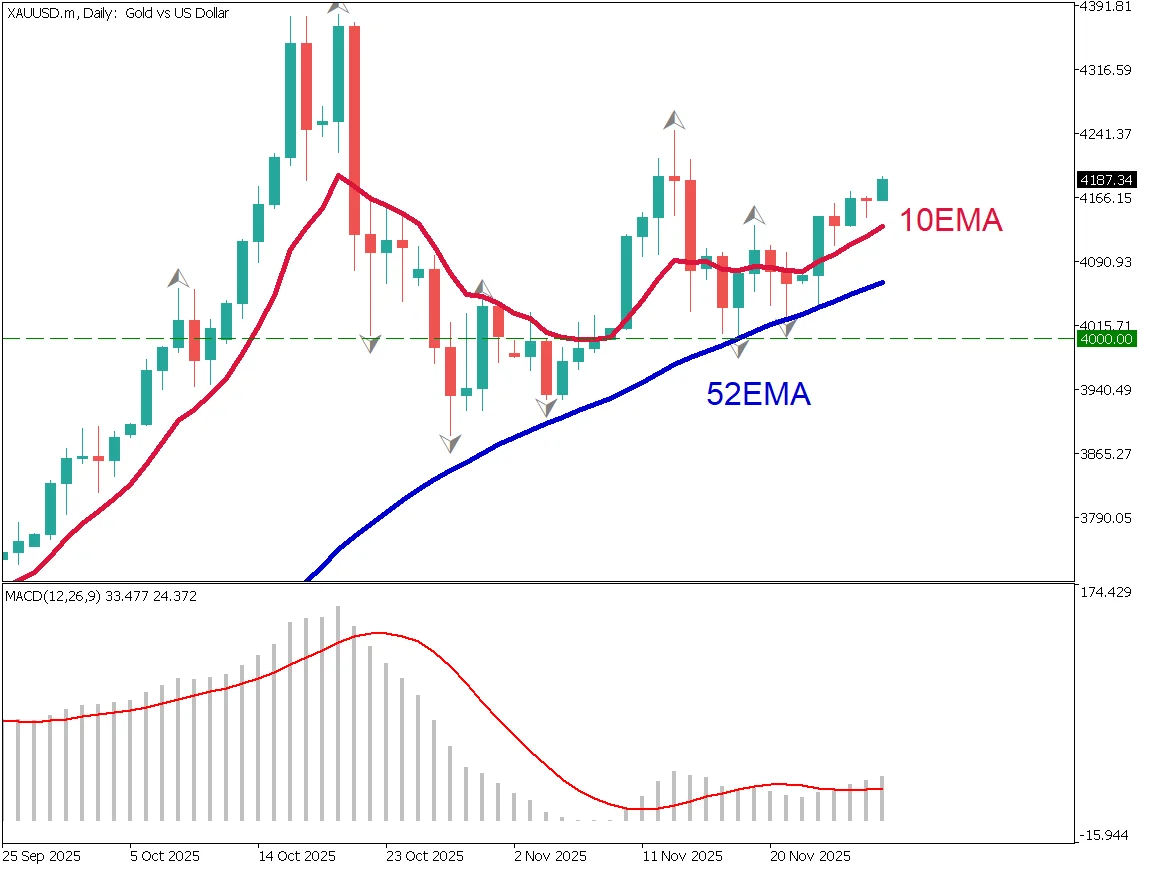
52EMA as Key Support
The daily gold chart shows four rebounds at the 52-day EMA, highlighting its role as a major support line. Gold rose to around 4380 dollars, then fell to the 3880 dollar area. Since then, it has regained a gentle upward trend and is currently hovering near 4190 dollars.
Geopolitical risks, expectations for Fed rate cuts, and declines in crypto assets all serve as buying factors for gold. Gold has moved back above the 10EMA, confirming the recovery of its upward trend.
The 4210-dollar level acts as a neckline. A breakout above 4210 could open the path toward new highs.
Gold – Intraday Trading Strategy
After a period of low volatility, gold sharply broke out. Bollinger Bands show a transition from a squeeze phase to an expansion phase.
MACD indicates bullish momentum as the histogram rises above the signal line. Upward movement is expected to continue today.
The intraday stance is long, with targets at 4210 and 4380 dollars.
For day trading, stop-loss should be placed below the 10EMA.
For swing trading, holding the position is acceptable as long as the price stays above the 52EMA.

Today's Key Economic Indicators
| Event/Indicator | Time |
|---|---|
| Germany CPI | 22:00 |
| Canada GDP | 22:30 |
Ready to trade?
Open live accountRelated Analysis
Gold Rises Further as U.S. Rate Cuts Accelerate
U.S. interest rate cuts continue to support gold prices. A rare "cup with handle" pattern has appeared on the gold chart, suggesting potential for further gains toward $4,400.
Can Gold Maintain the $4,000 Level?
Federal Reserve Governor Waller advocated for a rate cut in December, citing a weakening labor market. In Japan, despite the holiday, the yen continues to weaken gradually.
Gold Falls Below $4,000 as Risk-Off Sentiment Eases
Gold briefly fell below $4,000 as risk-off sentiment eased after the U.S.–China trade agreement. The metal is correcting after a sharp rally, with potential support near $3,955 and $3,880.
This material is for informational purposes only and does not constitute investment advice. Trading leveraged products involves significant risk of loss. Past performance is not indicative of future results.