Gold Remains in a Downtrend, $5,000 Acts as Strong Resistance

Daily Market Analysis
Expert analysis of today's market movements and trading opportunities
Daily Market Analysis
Expert analysis of today's market movements and trading opportunities
Fundamental Analysis
- Gold remains capped below the key $5,000 level, with weak upside momentum. Prices have fallen below the 10-day and 26-day moving averages, reinforcing the downtrend. A break lower could lead to a decline toward the 52-day moving average near $4,780. RSI stands at 42, signaling increasing downside pressure. The bias remains bearish unless gold climbs back above $4,980.
Fundamental Analysis
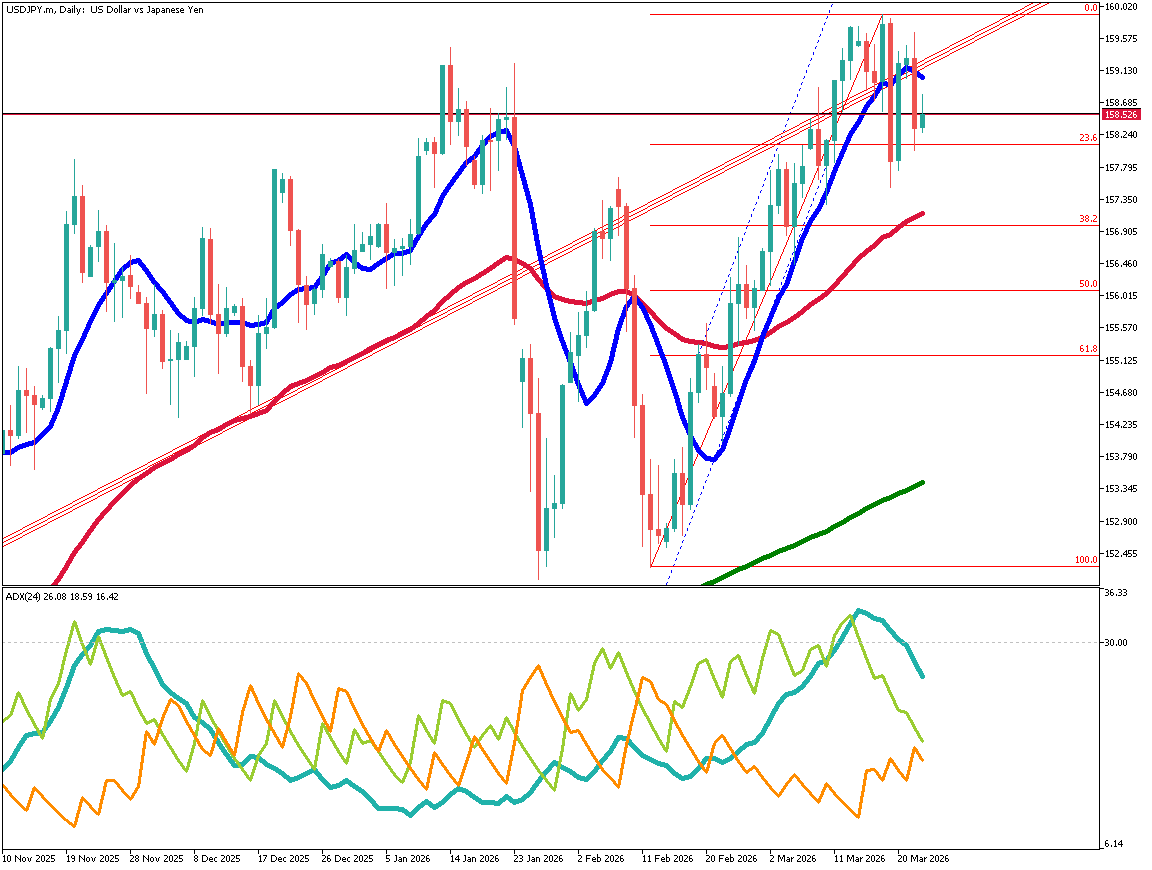
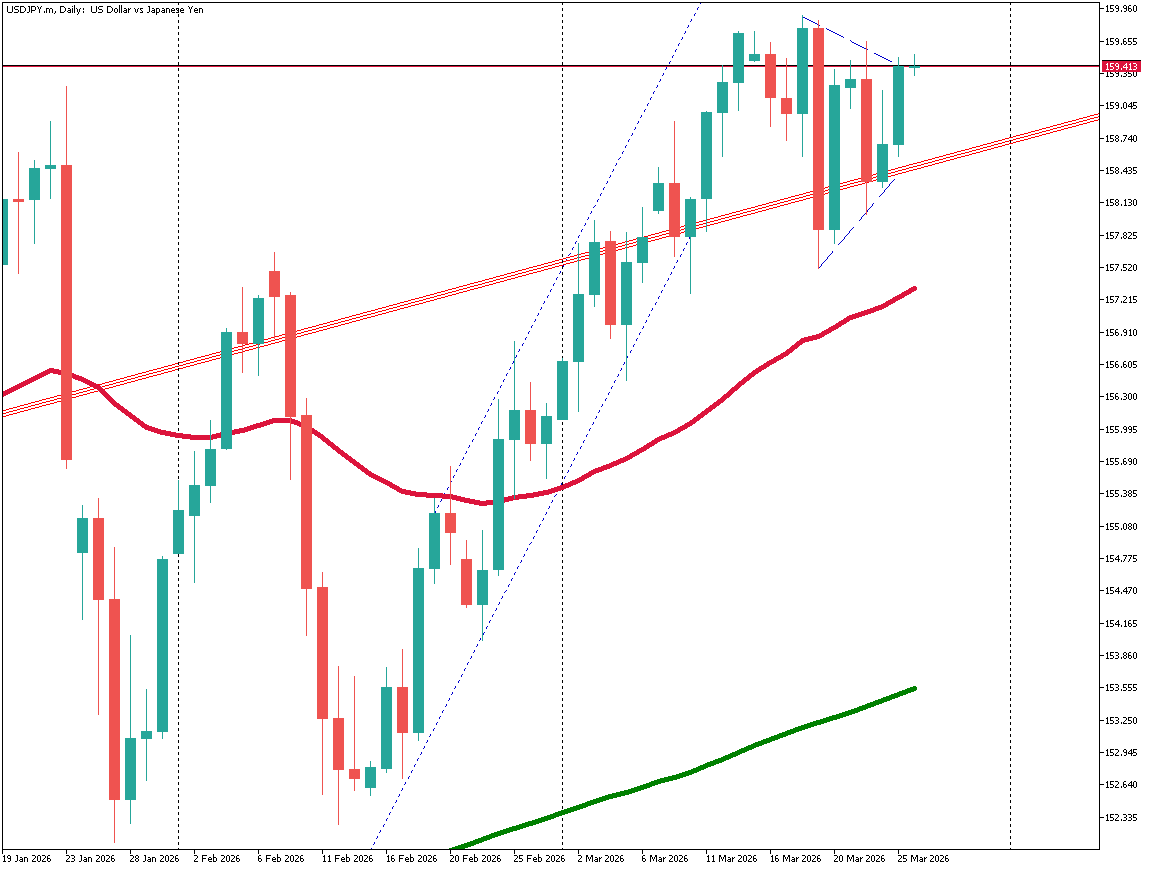
Japan’s GDP growth remains sluggish, leaving USD/JPY largely unchanged.
Outflows from the cryptocurrency market continue.
$5,000 Proves Heavy
Gold has failed to break above $5,000 and volatility remains extremely low. With market-moving factors temporarily exhausted, there appears to be little catalyst for further upside. The $5,000 level is acting as strong resistance. Prices have fallen below the 10-day and 26-day moving averages, signaling a downtrend. If gold breaks further below the 26-day moving average, it could decline toward the 52-day moving average around $4,780.
There is a possibility that the market will attempt to renew recent lows. If RSI falls below 50, downside pressure may accelerate.
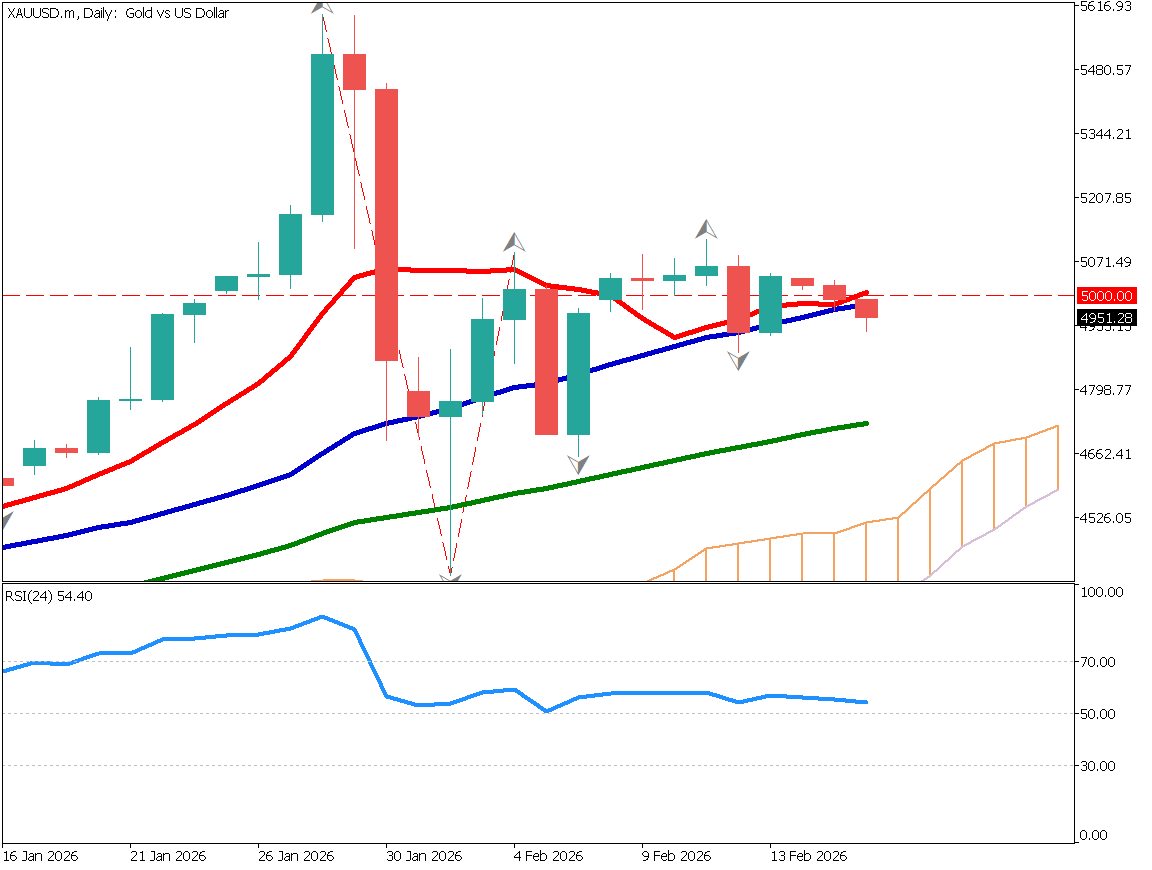
Gold / Daily Chart
Gold has been unable to make new highs. Although it temporarily recovered above $5,000, lower highs are forming, indicating strengthening downside pressure. From a chart perspective, the structure suggests a bearish trend. After confirming that the key psychological level is functioning as resistance, the market may aim to test new lows again.
RSI currently stands at 42, a level that reflects increasing selling pressure.
The basic strategy is to maintain a bearish stance, entering market sell orders with a target around $4,780. If price rises above $4,980, positions should be stopped out.
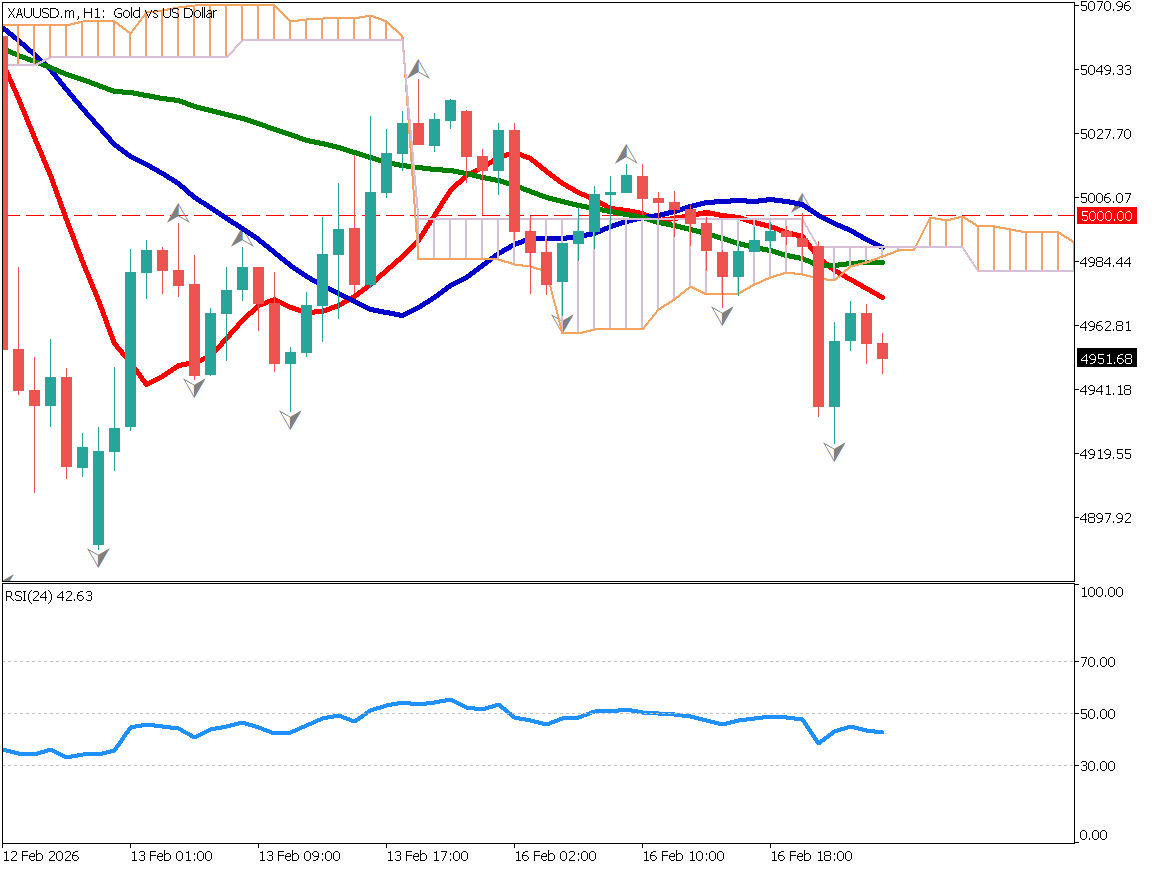
Gold / 1-Hour Chart
Today’s Economic Indicators
16:00 (JST) – Germany Consumer Price Index (January CPI)
16:00 (JST) – UK ILO Unemployment Rate (December)
19:00 (JST) – Germany ZEW Economic Sentiment (February)
22:30 (JST) – Canada Consumer Price Index (January CPI)
22:30 (JST) – U.S. New York Fed Manufacturing Index (February)
Ready to trade?
Open live accountRelated Analysis
This material is for informational purposes only and does not constitute investment advice. Trading leveraged products involves significant risk of loss. Past performance is not indicative of future results.