[London Market] Has Gold Returned to an Uptrend?

Daily Market Analysis
Expert analysis of today's market movements and trading opportunities
Daily Market Analysis
Expert analysis of today's market movements and trading opportunities
Fundamental Analysis
- Signs of the U.S. government reopening have emerged, and investors should watch for upcoming U.S. economic data releases
- The UK ILO unemployment rate worsened to 5.0%, exceeding expectations, indicating a deteriorating labor market
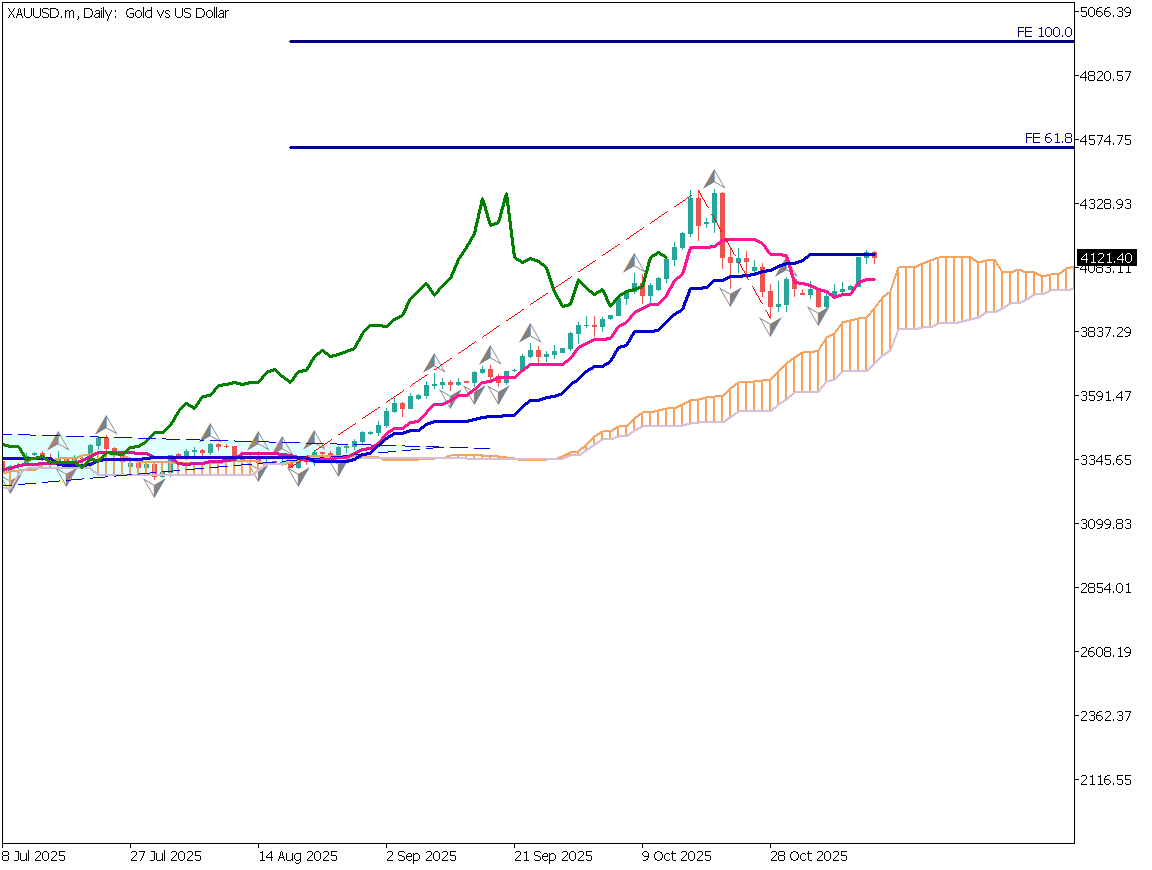
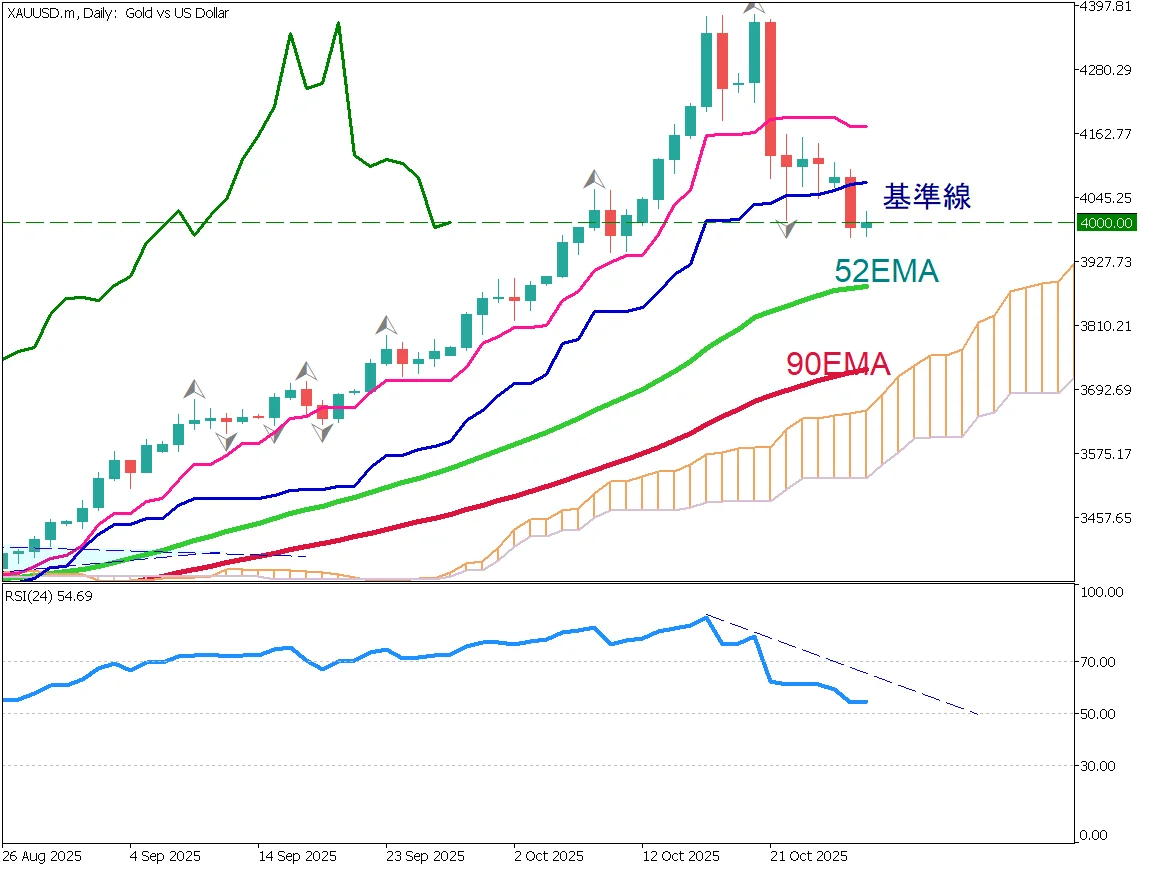
Gold Daily Chart
In the U.S., stock prices remain strong on the remnants of the AI boom. However, if U.S. unemployment rises, the dollar could weaken sharply, leading to renewed gold buying.
On the daily chart, gold faces resistance at the base line near 4,150 USD. A breakout above this level could pave the way toward a new record high. Based on Fibonacci expansion, targets can be projected at 4,550 USD (61.8%) and 4,950 USD (100%).
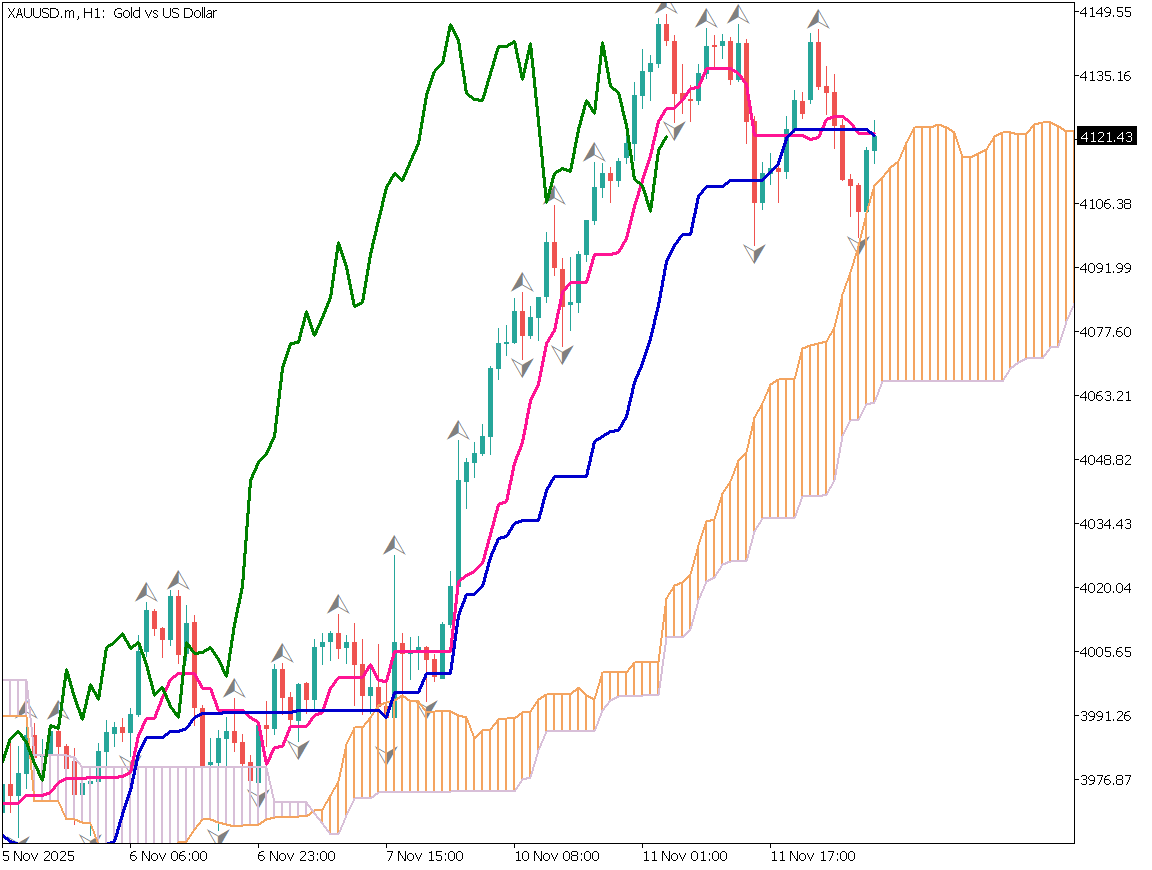
Gold Day-Trade Strategy
Four fractals have appeared around the 4,150 USD area. If positive catalysts for gold emerge, a strong breakout may occur. The Ichimoku Cloud offers solid support below, keeping the downside firm.
Gold remains in a range between 4,100 USD (support) and 4,150 USD (resistance). The cloud serves as a strong support zone, suggesting a potential upward move.
Given recent news, the U.S. labor market likely continues to weaken. If unemployment rises while AI-driven stock gains persist, the Fed may be forced to cut rates.
Rate cuts would lead to dollar selling and increased demand for gold as a safe haven.
Suggested Trading Plan
- Buy limit: around 4,100 USD
- Take profit: around 4,230 USD
- Stop loss: below 4,095 USD
Today's Key Indicator
Note: U.S. data releases may be delayed due to the government shutdown.
| Event | Time |
|---|---|
| Germany CPI | 16:00 (JST) |
Ready to trade?
Open live accountRelated Analysis
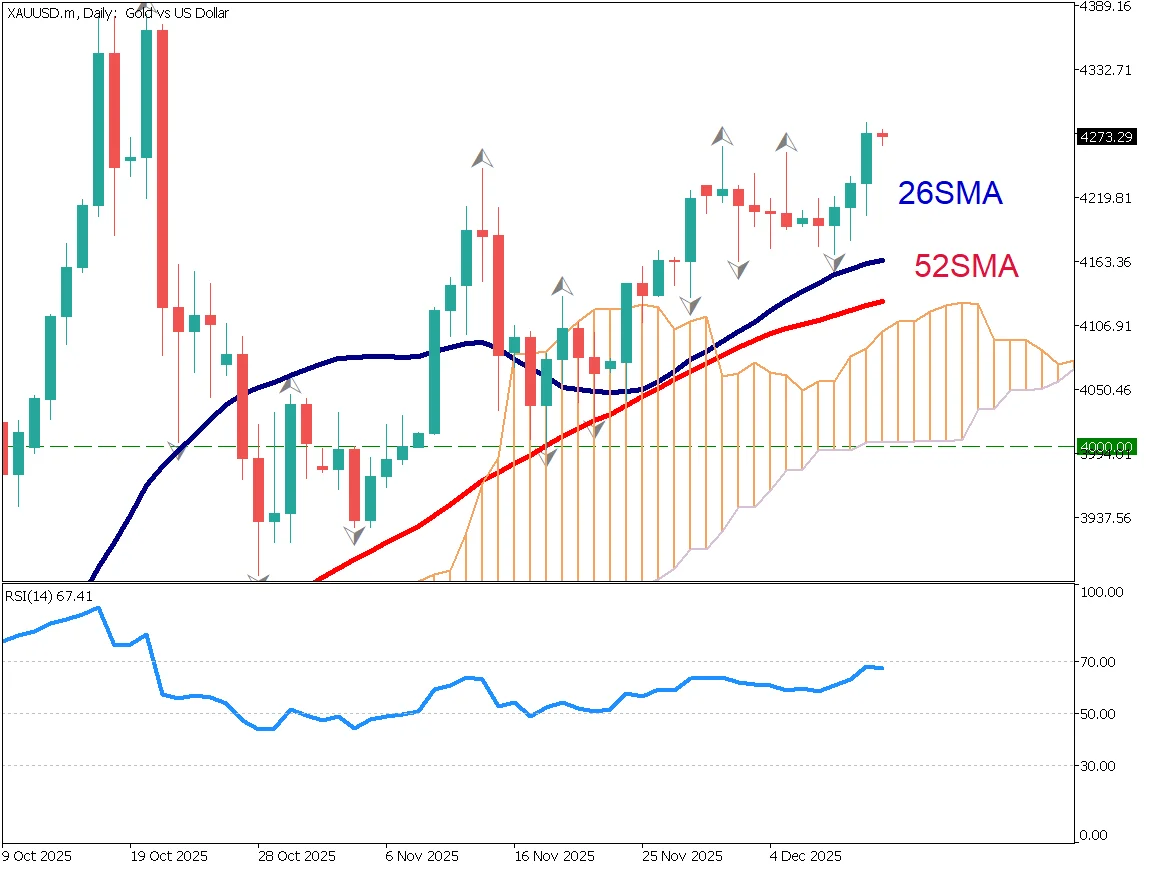
Gold Rises Further as U.S. Rate Cuts Accelerate
U.S. interest rate cuts continue to support gold prices. A rare "cup with handle" pattern has appeared on the gold chart, suggesting potential for further gains toward $4,400.
Can Gold Maintain the $4,000 Level?
Federal Reserve Governor Waller advocated for a rate cut in December, citing a weakening labor market. In Japan, despite the holiday, the yen continues to weaken gradually.
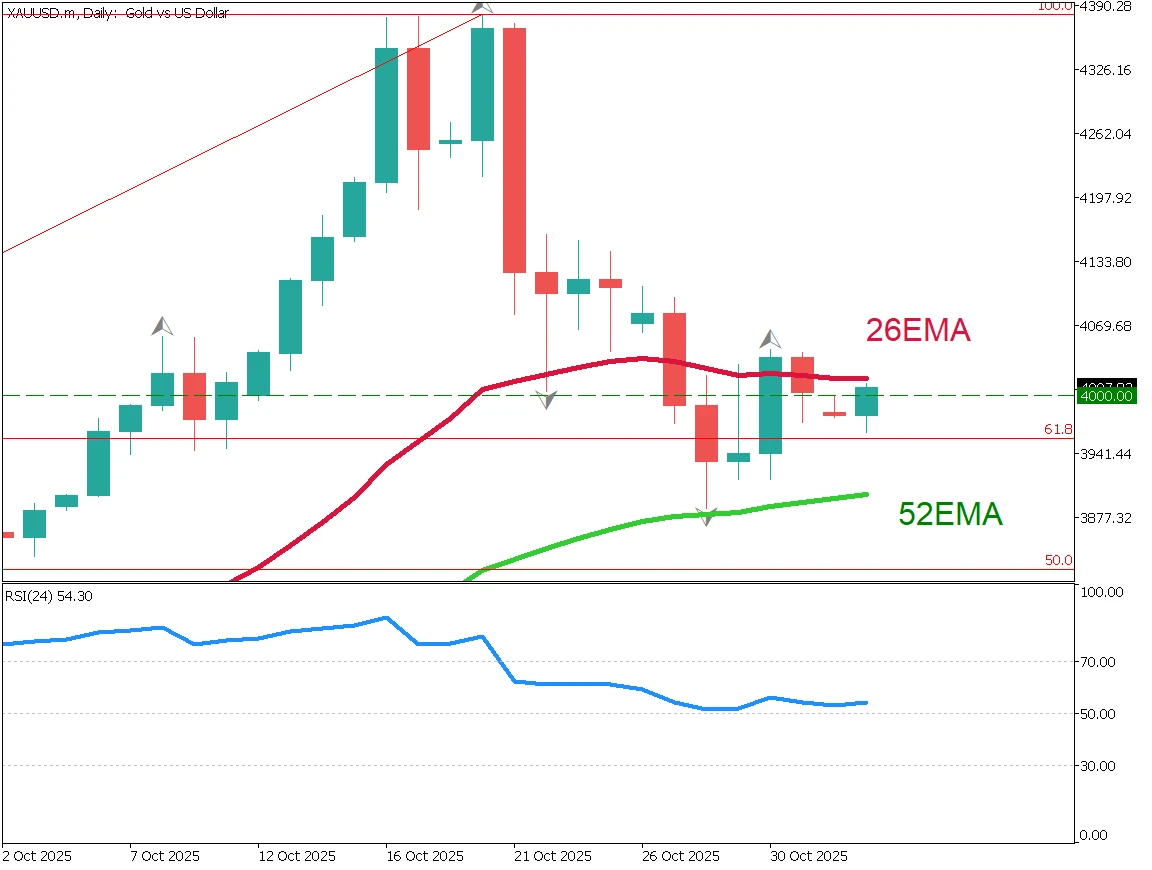
Gold Falls Below $4,000 as Risk-Off Sentiment Eases
Gold briefly fell below $4,000 as risk-off sentiment eased after the U.S.–China trade agreement. The metal is correcting after a sharp rally, with potential support near $3,955 and $3,880.
This material is for informational purposes only and does not constitute investment advice. Trading leveraged products involves significant risk of loss. Past performance is not indicative of future results.