Gold Reversal? Is a Selling Climax Occurring?

Daily Market Analysis
Expert analysis of today's market movements and trading opportunities
Daily Market Analysis
Expert analysis of today's market movements and trading opportunities
Fundamental Analysis
- Gold declined to around $4,000 after forming a double top and is now in a consolidation phase. On the daily chart, strong upper wicks and a strong USD suggest limited upside unless it breaks above $4,760. ADX indicates weak trend strength. On the 4-hour chart, a triangle pattern is forming with higher lows, and a breakout above $4,730 or below $4,175 will determine the next direction.
Today’s Video
Is Gold Reversing?
Gold is currently trading around $4,550. After forming a double top, it declined to around $4,000, and the corrective move appears to have paused. While the strength of the US dollar is notable in the market, the medium- to long-term outlook for gold remains bullish.
However, looking at the daily chart, prominent upper wicks suggest that dollar buying pressure is still dominant. Unless gold surpasses $4,760, it is unlikely to enter a full-fledged uptrend. The ADX is also below 30, indicating a lack of clear direction.
If gold fails around $4,700, there is a possibility of another drop to new lows, with $4,150 seen as a potential downside target.
[Gold / Daily Chart]
Higher Lows Suggest Trend Continuation
On the 4-hour chart, higher lows are forming, creating a triangle pattern. If this is a consolidation triangle, it suggests a continuation of the trend. The key level to watch is whether price can break above $4,730.
The RSI is around 50, indicating conditions where selling pressure on rebounds may increase.
A break above $4,730 or a close below $4,175 could serve as entry signals. For now, it may be best to stay on the sidelines.
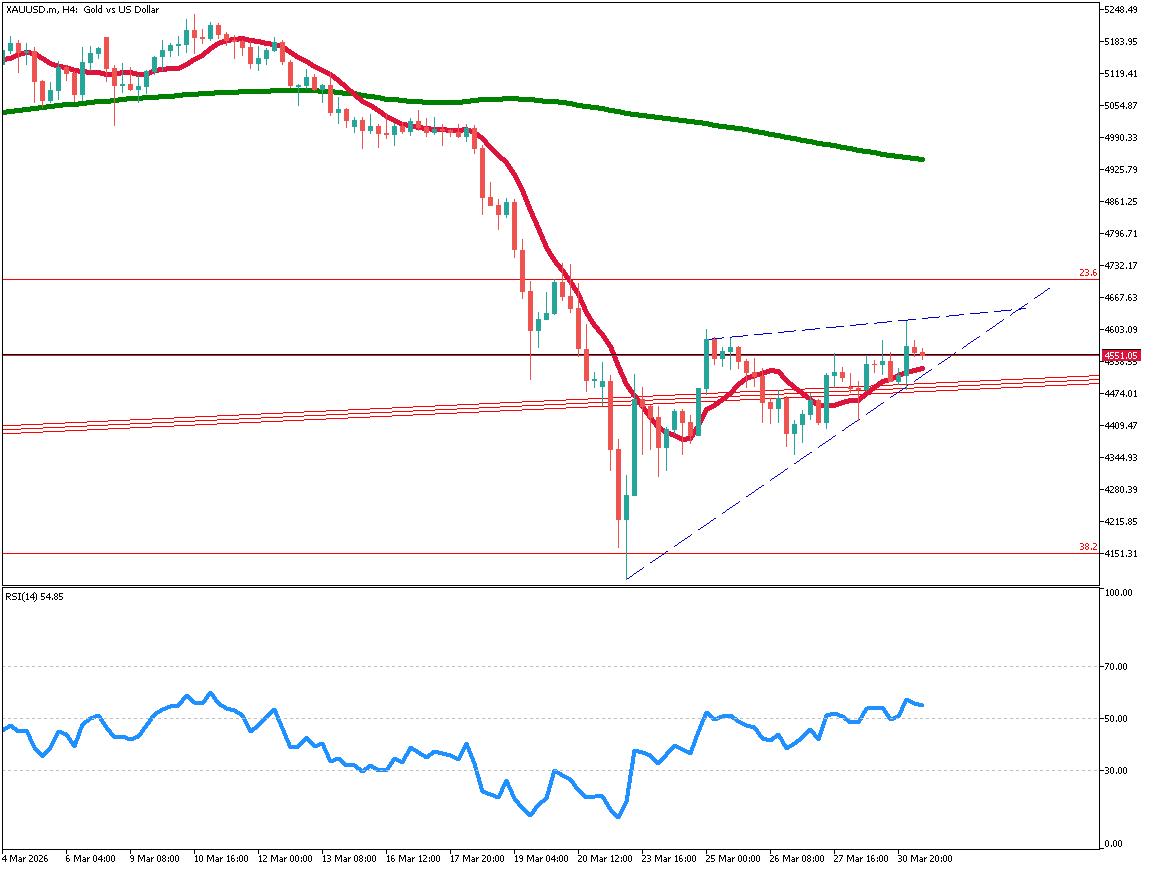
[Gold / 1-Hour Chart]
Ready to trade?
Open live accountRelated Analysis
This material is for informational purposes only and does not constitute investment advice. Trading leveraged products involves significant risk of loss. Past performance is not indicative of future results.