Milton Markets
Markets
Trading
Company
Partners
Sign InOpen Account
  1. Home/
  2. Market Analysis/
  3. U.S. economic indicators fell short of expectations; expectations of a halt in interest rate hikes but fears of economic deterioration【April 4, 2023】
Koki Ando•Apr 4, 2023

U.S. economic indicators fell short of expectations; expectations of a halt in interest rate hikes but fears of economic deterioration【April 4, 2023】

Koki Ando headshot

Daily Market Analysis

Koki AndoChief Market Analyst

Expert analysis of today's market movements and trading opportunities

Koki Ando headshot

Daily Market Analysis

Koki AndoChief Market Analyst

Expert analysis of today's market movements and trading opportunities

Fundamental Analysis

  • Crude Oil Surges, Rises in Big Window, Hovering Above USD 80
  • Australian and Canadian dollars continue to appreciate
  • U.S. ISM business sentiment index falls short of expectations, dollar weakens
  • S&P 500 Rises; Energy Stocks Gain Significantly
  • Stocks rise, gold rises
  • Gold sensitive to signs of U.S. economic deterioration in addition to dollar weakness

Technical Analysis

Oil prices rose sharply, and as expected, the resource-based currencies were heavily bid up. The impact of the coordinated production cut was significant and remained above USD 80/bbl. While there were expectations for a halt in interest rate hikes due to U.S. economic indicators falling below market expectations, there was a noticeable flow of funds into gold, a safe-haven asset, as it implies a worsening economy.

Today, the dollar is weakening and the Australian dollar is appreciating. Attention will be focused on the Australian policy rate announcement and the statement.

Gold (XAUUSD)

Gold rallied sharply after falling to USD 1950. The daily chart shows that the market remains range-bound, but the lower price looks very firm. The focus will be on whether or not the recent high of USD 2009 will be exceeded.

Since the U.S. economy is expected to deteriorate, a break above USD 2009 for some reason this month could lead to a big rally with stop-losses involved.
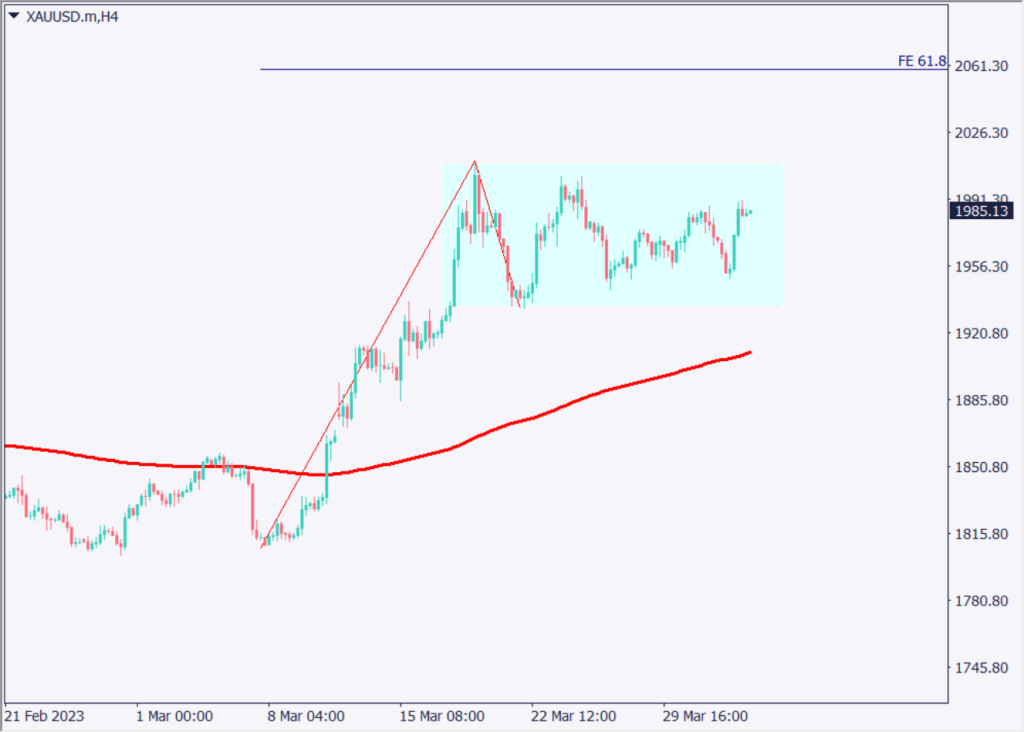
[XAUUSD / H4]
Estimated rangeUSD 1953 – USD 2014
Resistance lineUSD 1998
Support lineUSD 1969

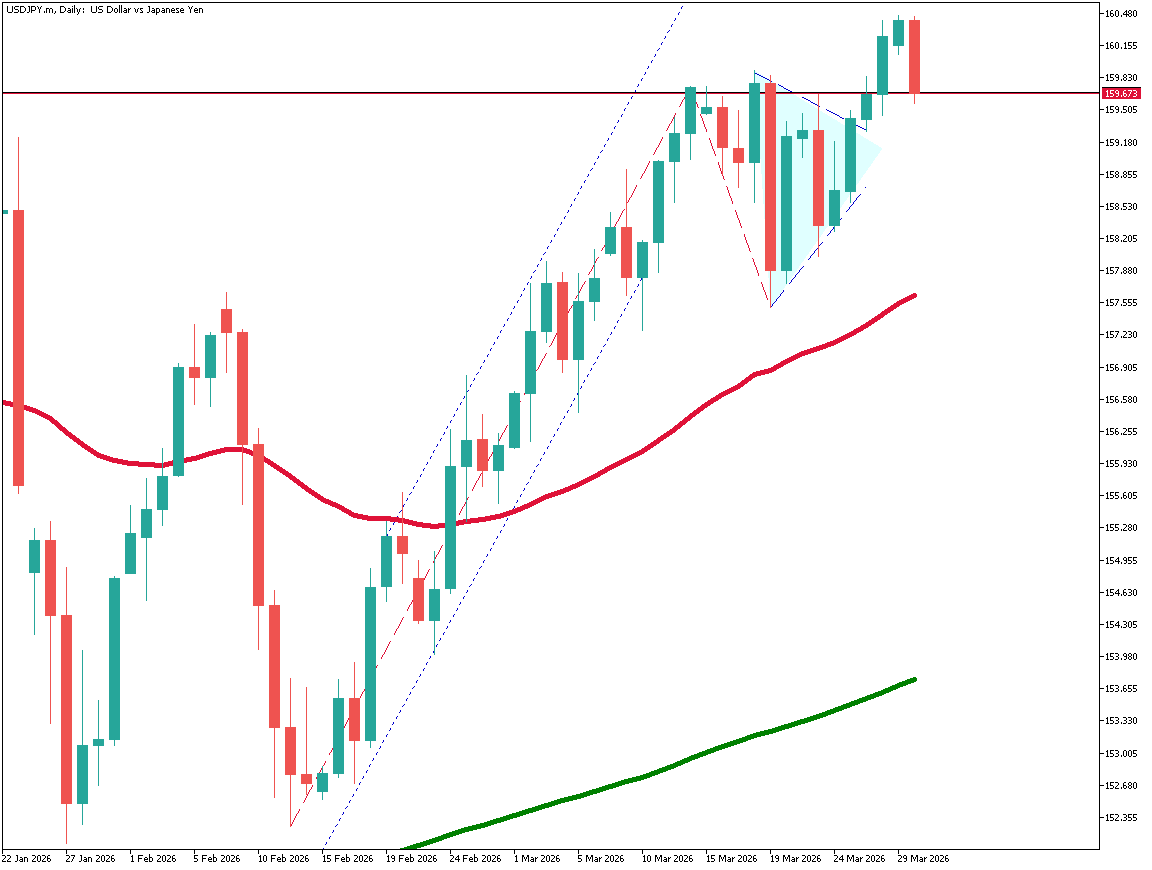
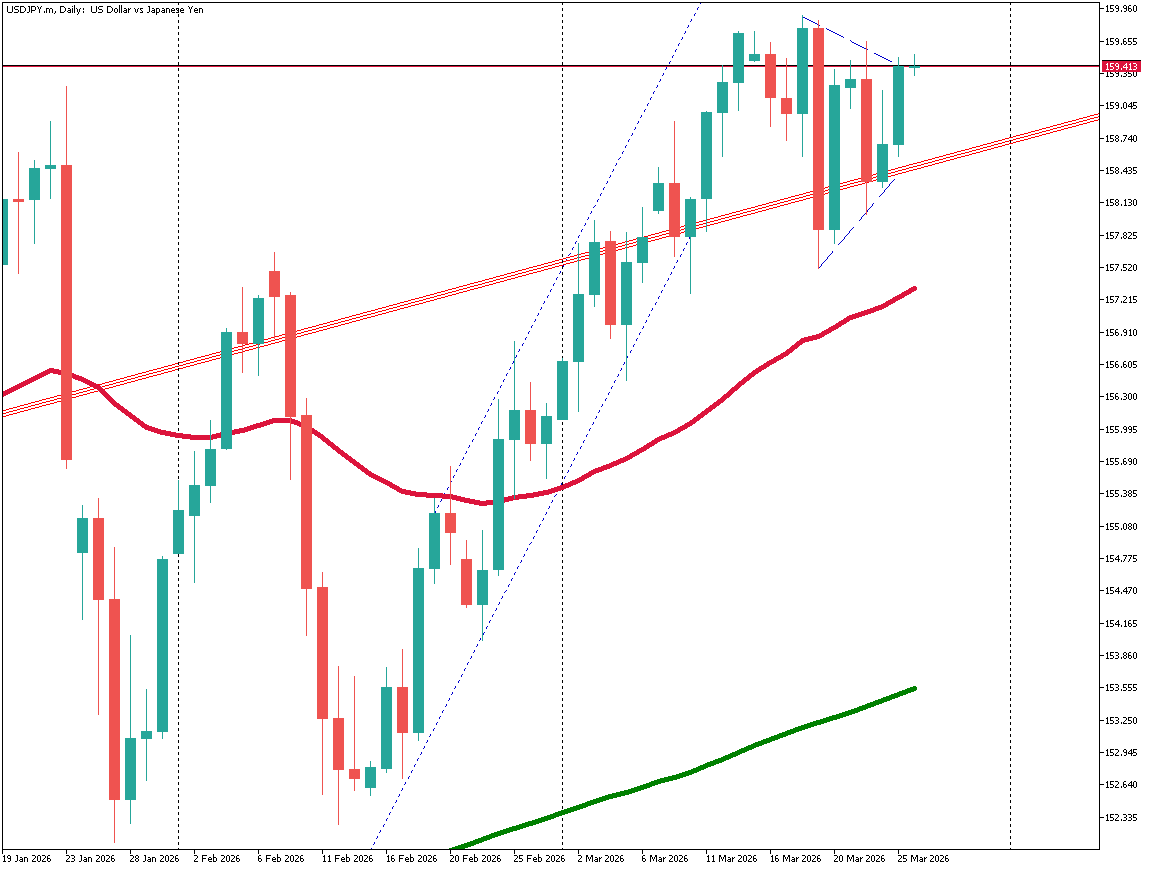
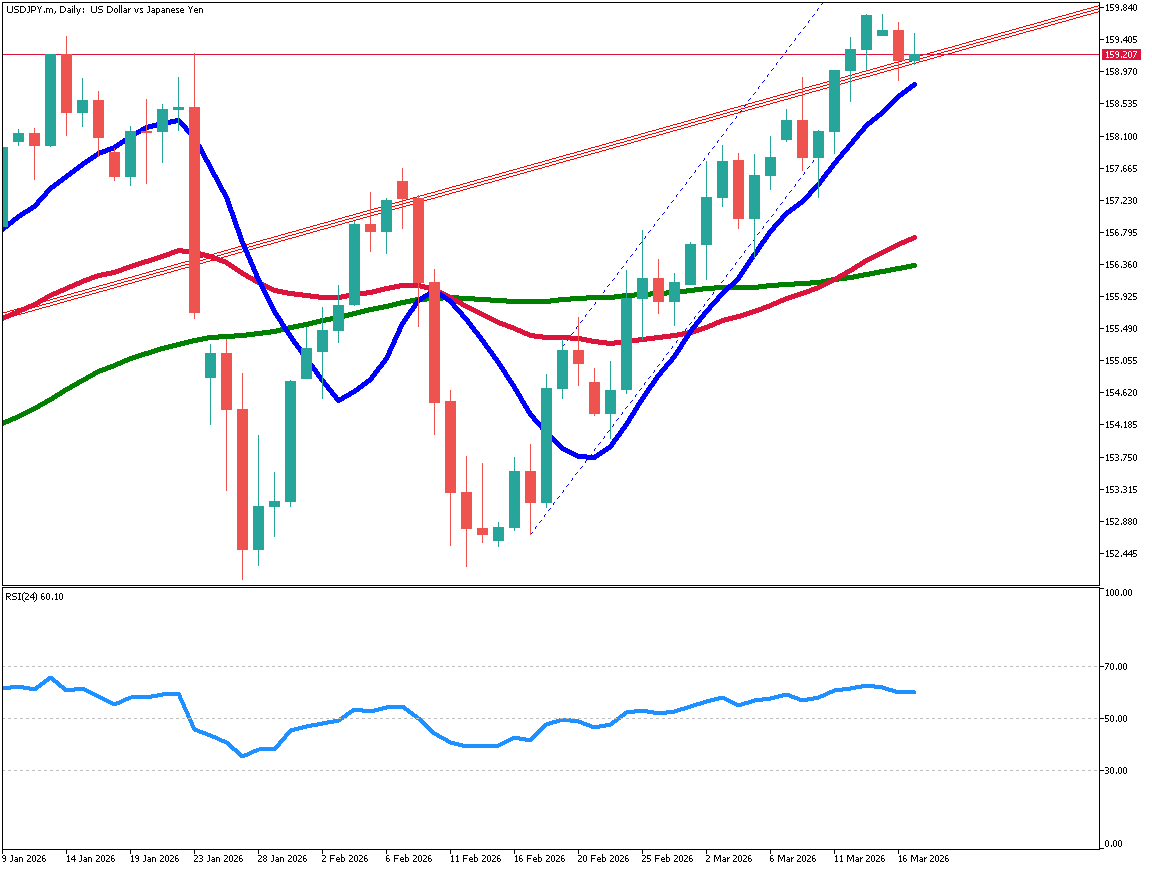
U.S. Dollar/Yen (USDJPY)

The dollar dropped sharply from the JPY 133 level. Analysis of the daily chart confirms that the pair is reacting to the reference line on the Ichimoku Kinko Chart. The pair is currently in the clouds, making it difficult to discern a sense of direction. The focus will be on this week’s U.S. employment data.
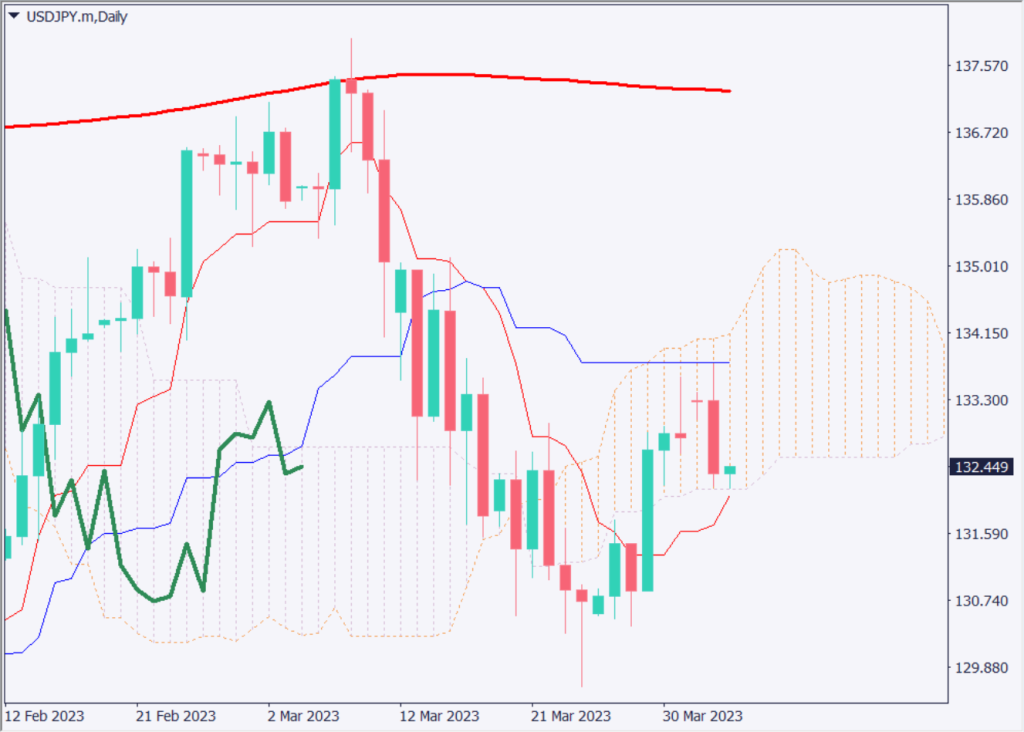
[USDJPY / D1]
Estimated rangeJPY 131.70- JPY 133.45
Resistance lineJPY 133.10
Support lineJPY 132

Australian Dollar Yen (AUDJPY)

The AUDJPY has exceeded the 50% Fibonacci retracement and is targeting 61.8%. The Australian dollar, a resource-rich currency, is becoming more easily bought, and we expect a target of JPY 90.35 going forward; a clear break above JPY 90 could lead the pair higher, with stops rolling in.
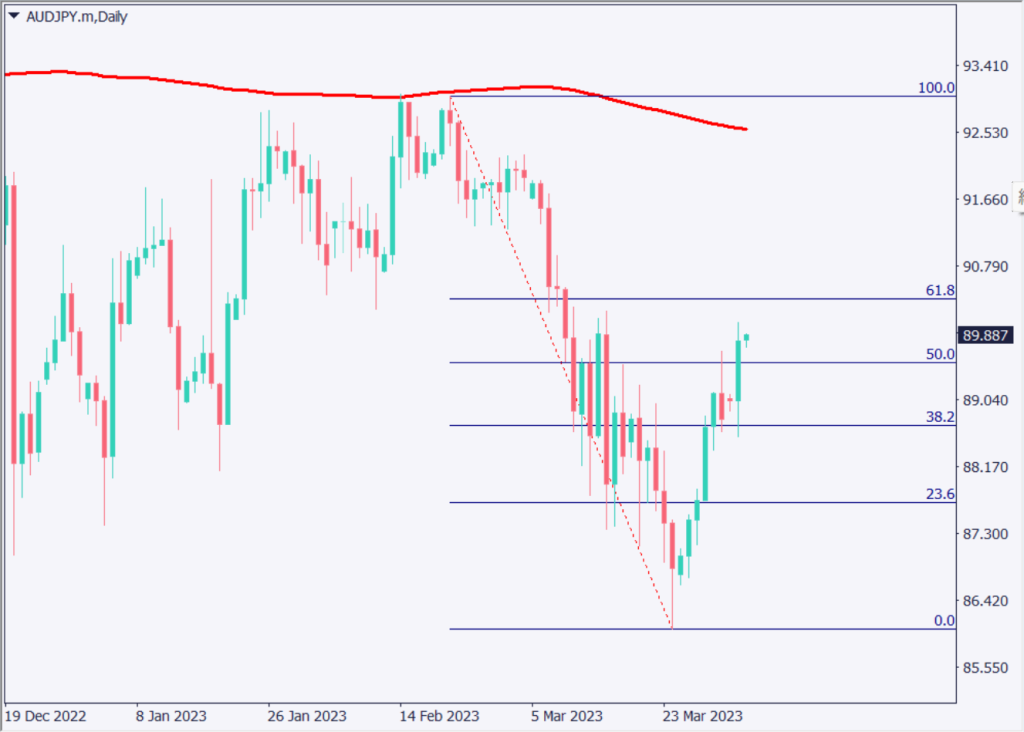
[AUDJPY / D1]
Estimated rangeJPY 88.60 – JPY91.00
Resistance lineJPY 90.50
Support lineJPY 89.00

Today’s Important Economic Indicators

Economic Indicators and EventsJST (Japan Standard Time)
Australian Policy Rate Announcement13:30

*Trading advice in this article is not provided by Milton Markets, but by Shu Fujiyasu Jr., a certified technical analyst.

Ready to trade?

Open live account

Related Analysis

USD/JPY: Selling Pressure Dominates on Rallies

USD/JPY: Selling Pressure Dominates on Rallies

7 days agoRead more →
USD/JPY dips slightly on LDP landslide victory

USD/JPY dips slightly on LDP landslide victory

8 days agoRead more →
Gold and Silver Continue to Hit Record Highs

Gold and Silver Continue to Hit Record Highs

20 days agoRead more →

This material is for informational purposes only and does not constitute investment advice. Trading leveraged products involves significant risk of loss. Past performance is not indicative of future results.

Share

X

Start trading today

  • Fast execution
  • Competitive spreads
  • 24/7 support
Open live accountView account types
Milton Markets
Twitter/XYouTube

Markets

FOREX
CRYPTO
COMMODITIES
INDICES
STOCKS

Trading

  • Flex Account
  • Smart Account
  • Elite Account
  • MetaTrader 5 (MT5)
  • MetaTrader 4 (MT4)
  • Launch WebTrader
  • Learn Hub
  • Economic Calendar
  • Promotions

Company

  • About Us
  • NDD Technology
  • Customer Protection
  • Execution Conditions
  • Company News
  • Blog
  • Market Analysis

Partners

  • IB Program
  • PAMM Program
  • White Label
  • Investor Login
  • Manager Login

Support

  • Terms of Service
  • Privacy Policy
  • Risk Disclosure
  • Contact Us
  • Help Center
  • My Page Login
Milton Markets is a trading name of Milton Markets Ltd. Milton Markets Ltd. is part of Milton Global and is registered in Saint Lucia (Registration Number: 2023-00166). As part of Milton Global, we adhere to the same high regulatory standards as Milton Global Ltd, which is regulated by the Seychelles Financial Services Authority (FSA) under license SD040.
Risk Warning: CFD trading carries high risk and may not suit all investors. You may lose more than your initial investment. Ensure you understand the risks before trading.
Restrictions: Milton Markets does not provide services to the following countries (not limited to these): United States, Canada, European Union countries, Iran, North Korea, Saint Vincent and the Grenadines, Afghanistan, American Samoa, Belarus, Russia, Burundi, Central African Republic, Congo (Brazzaville), Cuba, Iraq, Lebanon, Liberia, Libya, Myanmar, Puerto Rico, Rwanda, Somalia, Sudan, Syria, US Virgin Islands, Venezuela, Yemen, Zimbabwe, Côte d'Ivoire, Mali, Guinea, Eritrea.
You must be 18 years old or the legal age in your country of residence.
By opening an account, you are considered to have registered of your own volition without solicitation from Milton Markets.
Disclaimer: This website does not constitute investment advice. Content should not be construed as personal advice. Seek independent financial advice.
© 2026 Milton Markets. All rights reserved.
TermsPrivacyCookiesRisk