Milton Markets
Markets
Trading
Company
Partners
Sign InOpen Account
  1. Home/
  2. Market Analysis/
  3. U.S. Debt Ceiling Negotiations Reach Basic Agreement; Will Dollar-Yen Uptrend Strengthen?【May 29, 2023】
Koki Ando•May 29, 2023

U.S. Debt Ceiling Negotiations Reach Basic Agreement; Will Dollar-Yen Uptrend Strengthen?【May 29, 2023】

Koki Ando headshot

Daily Market Analysis

Koki AndoChief Market Analyst

Expert analysis of today's market movements and trading opportunities

Koki Ando headshot

Daily Market Analysis

Koki AndoChief Market Analyst

Expert analysis of today's market movements and trading opportunities

Fundamental Analysis

  • Nasdaq Market Sharply Higher; AI in the Spotlight; NVIDIA Surges
  • US Debt Ceiling Negotiations Reach Basic Agreement, Risk-On Market as US Default is Averted
  • The yen was down across the board in the forex markets, with the safe-haven yen selling off easily in the risk-on market.
  • USD/JPY continues to rise for 3 days, aiming for JPY 142.25, a key resistance level in the past
  • Eurodollar is in a downtrend and a band walk is in progress

USDJPY Technical Analysis

Weekend Analysis and Outlook for the Week (Daily)

The dollar has been rising for three consecutive days and did not lose its upward momentum last Friday, with a push around JPY 139.50 and a quick close above JPY 140. A strong band walk is occurring on the daily basis.

The price area to be aware of this week is expected to be around JPY 142.250, as JPY 142.250 corresponds to the return high of last November. In addition, a large resistance zone exists in the vicinity of JPY 142.180 to JPY 142.30. We believe that an adjustment move this week could occur around the JPY 142.00 area.
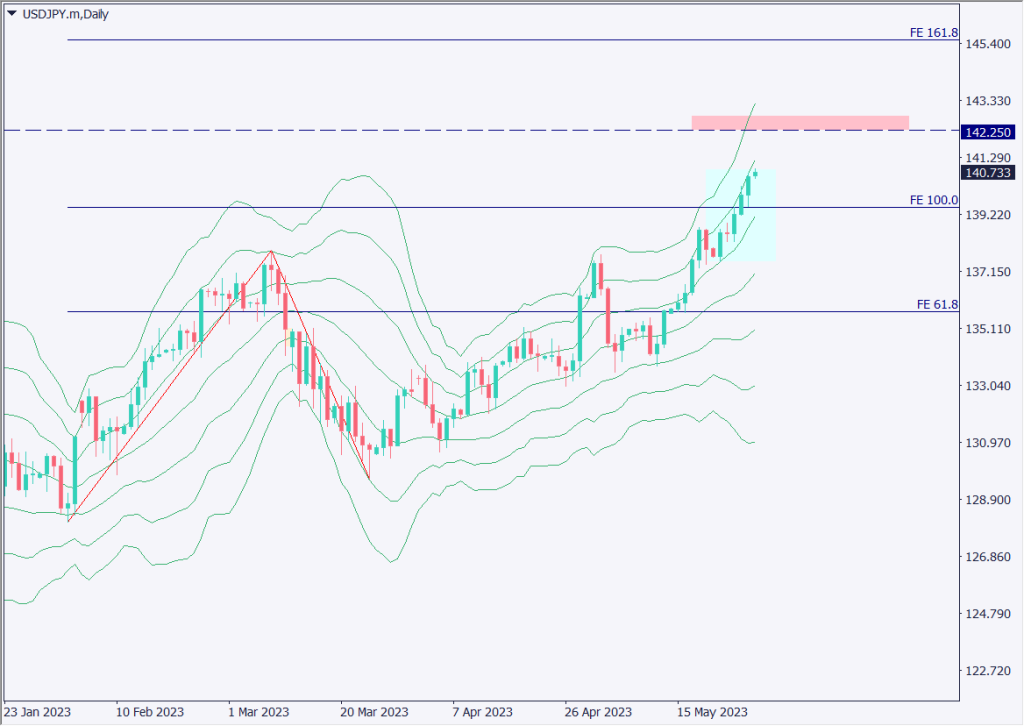
[USDJPY / D1]
Weekly Range ForecastJPY 138.90- JPY 143.88
Main Resistance ZoneJPY 142.18 – JPY 142.30
Daily TrendRising trend

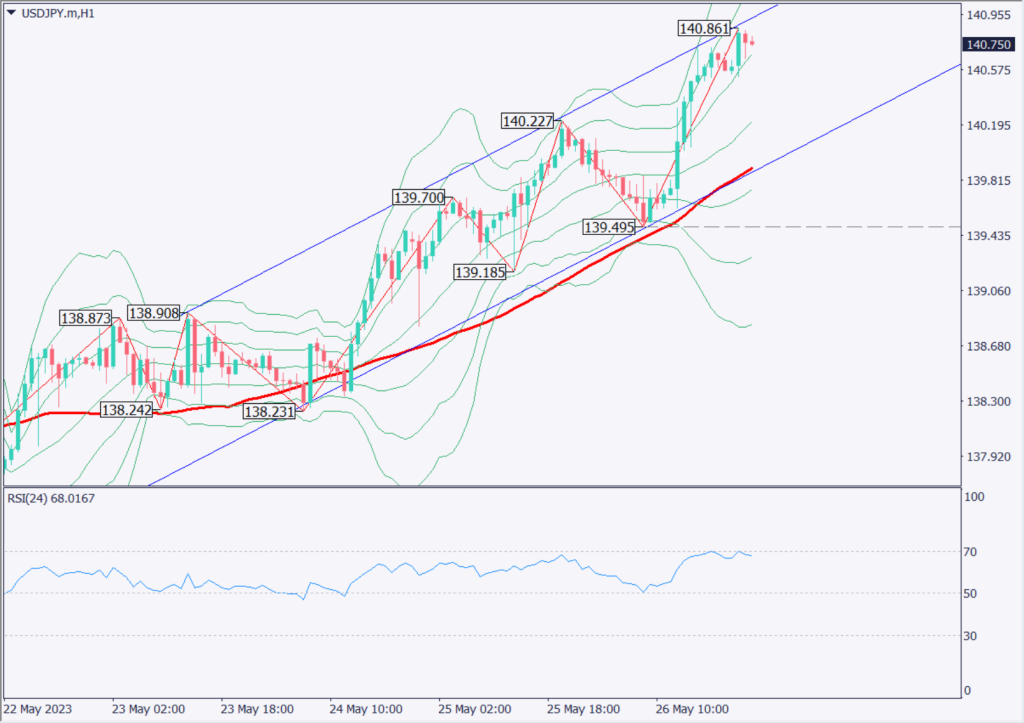
Day Trade Strategy (Hourly)

The day trading policy is to continue to push the market. Volatility is likely to be low today as the U.S. market is closed. Since the price surged from JPY 137 to JPY 140 last week, we need to be careful of an adjustment today.

Channel

An ascending channel can be drawn on the hourly time frame. Since the price is currently touching the upper limit of the channel band, it is possible that the price may fall back. However, the +1σ of the Bollinger Band is functioning as a support line.

RSI

The RSI value has reached 70 and is currently at 68. Since it has reached the general overbought level, it would not be surprising to see an adjustment.

Support and Resistance Lines

The resistance line to be considered in the future is as follows

JPY 141.48 – Fibonacci Expansion (100%)
JPY 140.70 – Pivot point

[USDJPY / H1]

Market Sentiment

USDJPY Sell: 76% Buy: 24%

Today’s Important Economic Indicators

Economic Indicators and EventsJST (Japan Standard Time)
U.S. National Holiday – Stock Markets Closed–

*Trading advice in this article is not provided by Milton Markets, but by Shu Fujiyasu Jr., a certified technical analyst.

Ready to trade?

Open live account

Related Analysis

USD/JPY dips slightly on LDP landslide victory

USD/JPY dips slightly on LDP landslide victory

8 days agoRead more →
Gold Remains in a Downtrend, $5,000 Acts as Strong Resistance

Gold Remains in a Downtrend, $5,000 Acts as Strong Resistance

TodayRead more →
Gold and Silver Continue to Hit Record Highs

Gold and Silver Continue to Hit Record Highs

20 days agoRead more →

This material is for informational purposes only and does not constitute investment advice. Trading leveraged products involves significant risk of loss. Past performance is not indicative of future results.

Share

X

Start trading today

  • Fast execution
  • Competitive spreads
  • 24/7 support
Open live accountView account types
Milton Markets
Twitter/XYouTube

Markets

FOREX
CRYPTO
COMMODITIES
INDICES
STOCKS

Trading

  • Flex Account
  • Smart Account
  • Elite Account
  • MetaTrader 5 (MT5)
  • MetaTrader 4 (MT4)
  • Launch WebTrader
  • Learn Hub
  • Economic Calendar
  • Promotions

Company

  • About Us
  • NDD Technology
  • Customer Protection
  • Execution Conditions
  • Company News
  • Blog
  • Market Analysis

Partners

  • IB Program
  • PAMM Program
  • White Label
  • Investor Login
  • Manager Login

Support

  • Terms of Service
  • Privacy Policy
  • Risk Disclosure
  • Contact Us
  • Help Center
  • My Page Login
Milton Markets is a trading name of Milton Markets Ltd. Milton Markets Ltd. is part of Milton Global and is registered in Saint Lucia (Registration Number: 2023-00166). As part of Milton Global, we adhere to the same high regulatory standards as Milton Global Ltd, which is regulated by the Seychelles Financial Services Authority (FSA) under license SD040.
Risk Warning: CFD trading carries high risk and may not suit all investors. You may lose more than your initial investment. Ensure you understand the risks before trading.
Restrictions: Milton Markets does not provide services to the following countries (not limited to these): United States, Canada, European Union countries, Iran, North Korea, Saint Vincent and the Grenadines, Afghanistan, American Samoa, Belarus, Russia, Burundi, Central African Republic, Congo (Brazzaville), Cuba, Iraq, Lebanon, Liberia, Libya, Myanmar, Puerto Rico, Rwanda, Somalia, Sudan, Syria, US Virgin Islands, Venezuela, Yemen, Zimbabwe, Côte d'Ivoire, Mali, Guinea, Eritrea.
You must be 18 years old or the legal age in your country of residence.
By opening an account, you are considered to have registered of your own volition without solicitation from Milton Markets.
Disclaimer: This website does not constitute investment advice. Content should not be construed as personal advice. Seek independent financial advice.
© 2026 Milton Markets. All rights reserved.
TermsPrivacyCookiesRisk