Milton Markets
Markets
Trading
Company
Partners
Sign InOpen Account
  1. Home/
  2. Market Analysis/
  3. Dollar/Yen continues to fall, focus on today’s U.S. employment data【June 2, 2023】
Koki Ando•Jun 2, 2023

Dollar/Yen continues to fall, focus on today’s U.S. employment data【June 2, 2023】

Koki Ando headshot

Daily Market Analysis

Koki AndoChief Market Analyst

Expert analysis of today's market movements and trading opportunities

Koki Ando headshot

Daily Market Analysis

Koki AndoChief Market Analyst

Expert analysis of today's market movements and trading opportunities

Fundamental Analysis

  • U.S. ADP Employment Report Exceeds Market Estimates, 278,000; Wage Growth Declines
  • U.S. jobs report due out today, estimate 195,000
  • Fed Governor and Fed Chair Jerome Powell support halting interest rate hikes, halting dollar strength
  • USD/JPY remains on a downtrend, hovering around JPY 138.820

USDJPY Technical Analysis

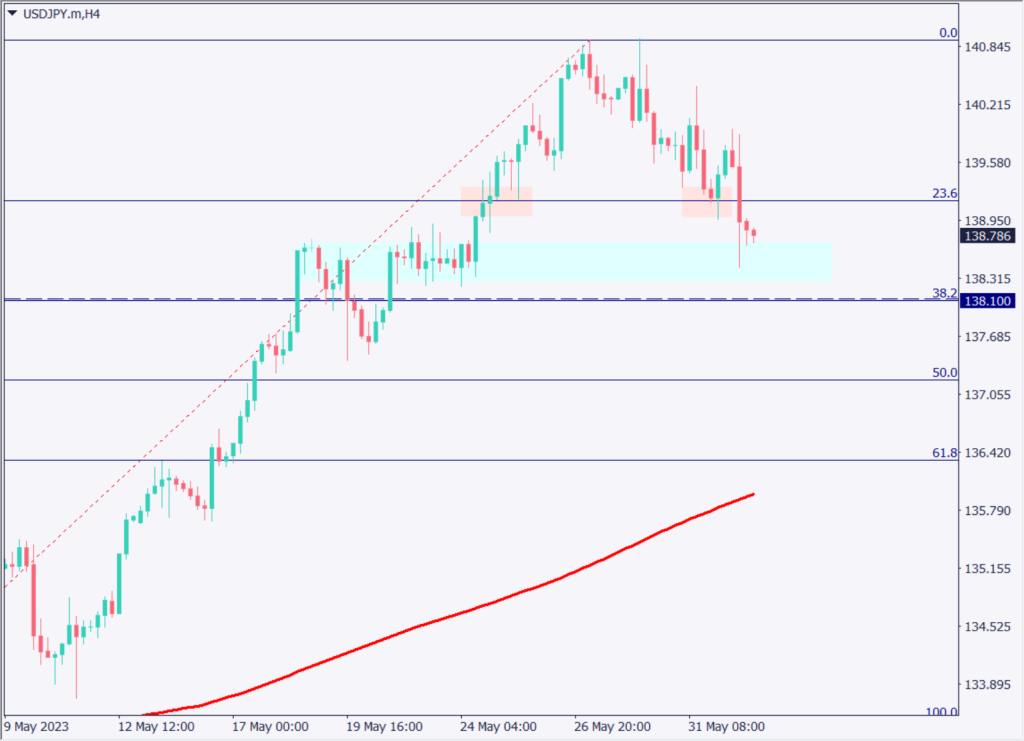
The USD/JPY has shifted the stage from the JPY 139 level to the JPY 138 level due to increased volatility at the beginning of the month. On the 1-hour timeframe, the pair is still in a downtrend, having fallen below the 240 moving average. On the 4-hour time frame, the Fibonacci retracement and the price range formed in the past, and on the 1-hour time frame, the formation of a descending channel should be watched.

Swing Analysis (4-hourly)

Analyzing the 4-hour chart of the dollar-yen, the 138.30-138.70 range, which is the price range of the range formed in the past, may serve as a support band. Whether or not the downward momentum will strengthen in the future is still likely to be determined by the FOMC meeting to be held on June 13-14. Since this is a rather large support zone, there is a possibility that profit-taking and push-buying may take place.

[USDJPY / H4]

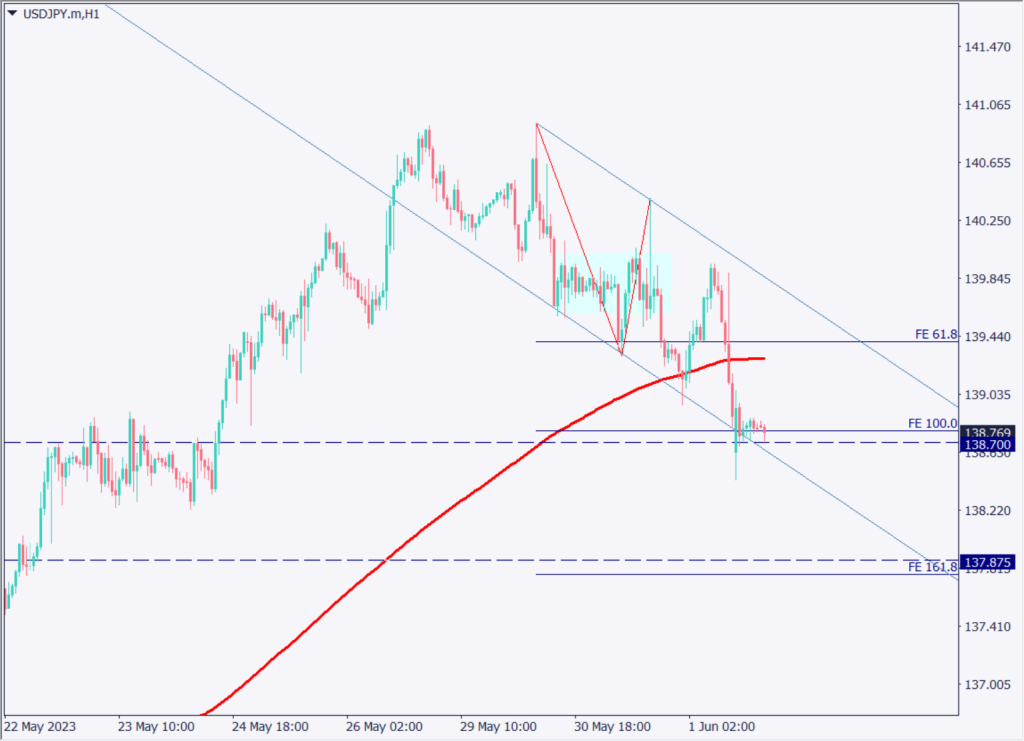
Day Trade Strategy (Hourly)

Analyzing the 1-hour chart of the USD/JPY, the main focus on the 1-hour chart is the formation of the descending channel and the target price based on the Fibonacci Expansion.

Currently, the pair is hovering near the lower band of the descending channel, and we note the possibility of an adjustment rebound once it occurs. In particular, after the release of the employment data, weekend position adjustment moves are likely to occur, which may result in short-covering. Even in the event of a rally, we expect it to be short-lived due to the presence of moving averages. Although it depends on the employment data, we should keep in mind that the support band is thick.

Support and Resistance Lines

The resistance line to be considered in the future is as follows

138.30 yen – Lower limit of the past range price
138.10 yen – Fibonacci retracement (38.2%)
137.87 yen – Fibonacci Expansion (161.8%)

[USDJPY / H1]

Market Sentiment

USDJPY Sell: 67% Buy: 33%

Today’s Important Economic Indicators

Economic Indicators and EventsJST (Japan Standard Time)
U.S. Employment Statistics21:30
U.S. ISM Manufacturing Purchasing Managers’ Index23:00

*Trading advice in this article is not provided by Milton Markets, but by Shu Fujiyasu Jr., a certified technical analyst.

Ready to trade?

Open live account

Related Analysis

Gold Remains in a Downtrend, $5,000 Acts as Strong Resistance

Gold Remains in a Downtrend, $5,000 Acts as Strong Resistance

TodayRead more →
USD/JPY Forms a Range — What’s Next?

USD/JPY Forms a Range — What’s Next?

1 day agoRead more →
Gold and Silver Continue to Hit Record Highs

Gold and Silver Continue to Hit Record Highs

20 days agoRead more →

This material is for informational purposes only and does not constitute investment advice. Trading leveraged products involves significant risk of loss. Past performance is not indicative of future results.

Share

X

Start trading today

  • Fast execution
  • Competitive spreads
  • 24/7 support
Open live accountView account types
Milton Markets
Twitter/XYouTube

Markets

FOREX
CRYPTO
COMMODITIES
INDICES
STOCKS

Trading

  • Flex Account
  • Smart Account
  • Elite Account
  • MetaTrader 5 (MT5)
  • MetaTrader 4 (MT4)
  • Launch WebTrader
  • Learn Hub
  • Economic Calendar
  • Promotions

Company

  • About Us
  • NDD Technology
  • Customer Protection
  • Execution Conditions
  • Company News
  • Blog
  • Market Analysis

Partners

  • IB Program
  • PAMM Program
  • White Label
  • Investor Login
  • Manager Login

Support

  • Terms of Service
  • Privacy Policy
  • Risk Disclosure
  • Contact Us
  • Help Center
  • My Page Login
Milton Markets is a trading name of Milton Markets Ltd. Milton Markets Ltd. is part of Milton Global and is registered in Saint Lucia (Registration Number: 2023-00166). As part of Milton Global, we adhere to the same high regulatory standards as Milton Global Ltd, which is regulated by the Seychelles Financial Services Authority (FSA) under license SD040.
Risk Warning: CFD trading carries high risk and may not suit all investors. You may lose more than your initial investment. Ensure you understand the risks before trading.
Restrictions: Milton Markets does not provide services to the following countries (not limited to these): United States, Canada, European Union countries, Iran, North Korea, Saint Vincent and the Grenadines, Afghanistan, American Samoa, Belarus, Russia, Burundi, Central African Republic, Congo (Brazzaville), Cuba, Iraq, Lebanon, Liberia, Libya, Myanmar, Puerto Rico, Rwanda, Somalia, Sudan, Syria, US Virgin Islands, Venezuela, Yemen, Zimbabwe, Côte d'Ivoire, Mali, Guinea, Eritrea.
You must be 18 years old or the legal age in your country of residence.
By opening an account, you are considered to have registered of your own volition without solicitation from Milton Markets.
Disclaimer: This website does not constitute investment advice. Content should not be construed as personal advice. Seek independent financial advice.
© 2026 Milton Markets. All rights reserved.
TermsPrivacyCookiesRisk