Milton Markets
Markets
Trading
Company
Partners
Sign InOpen Account
  1. Home/
  2. Market Analysis/
  3. Gold on an upward trend, anticipating a peak out in U.S. interest rates?【July 19, 2023】
Koki Ando•Jul 19, 2023

Gold on an upward trend, anticipating a peak out in U.S. interest rates?【July 19, 2023】

Koki Ando headshot

Daily Market Analysis

Koki AndoChief Market Analyst

Expert analysis of today's market movements and trading opportunities

Koki Ando headshot

Daily Market Analysis

Koki AndoChief Market Analyst

Expert analysis of today's market movements and trading opportunities

Fundamental Analysis

  • U.S. Stock Indexes Rebound, Broader Buying Orders for AI-Related Stocks
  • Gold rises; lower 10-year US Treasury yields put upward pressure on gold
  • 0.25% rate hike factored into next week’s U.S. FOMC meeting; focus on whether a rate hike is likely after August

XAUUSD Technical Analysis

Analyze the daily chart of Gold. Drawing a Fibonacci retracement on the major recent uptrend, we can see that it reacted at 38.2%. It rebounded at 61.8% (USD 1903) and recovered to 38.2% (USD 1978). This USD 1978 corresponds to the lower end of the past range, which may lead to a certain amount of profit taking and new sell orders.

Confirming market sentiment, 78% of the positions are sell positions, indicating a considerable degree of selling pressure. The possibility of a breakout involving stop losses cannot be ruled out.

Day Trading Strategy (Hourly)

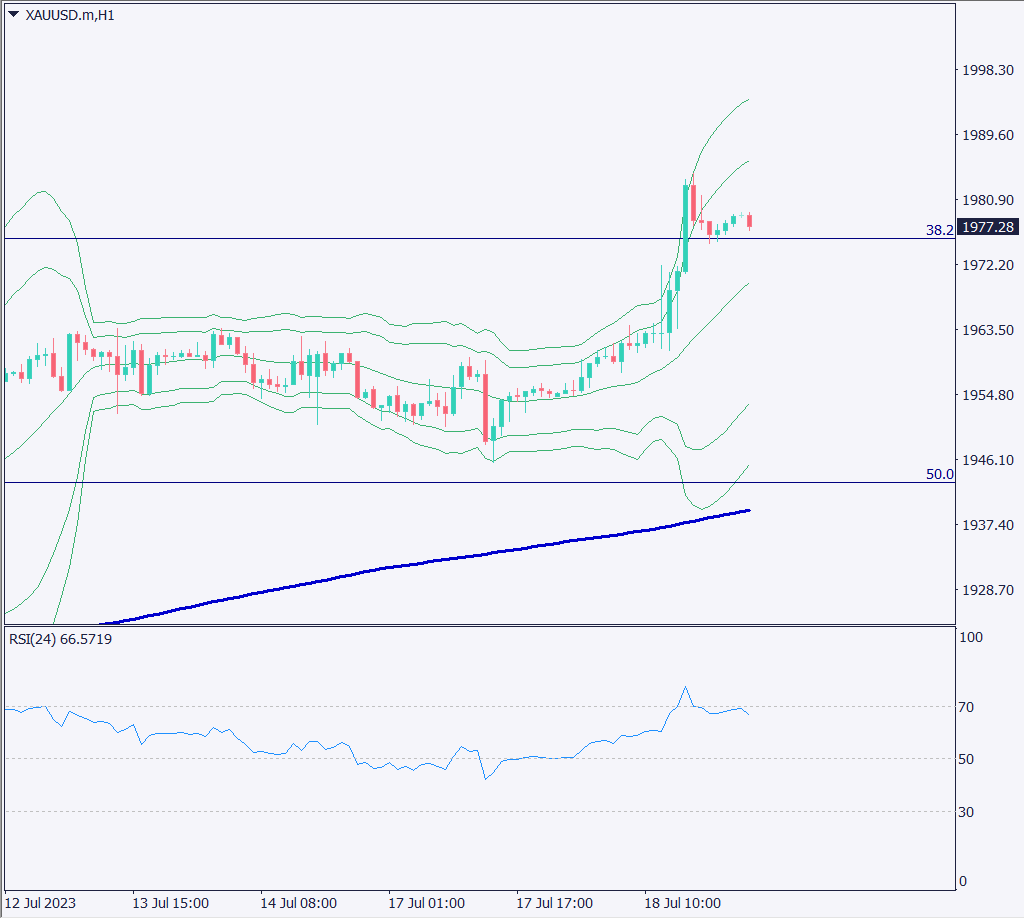
The day-trade policy is to buy on the push side; checking the hourly chart, the support band is at 38.2%. Although the price fell back at the +3σ of the Bollinger band, we believe that this is a temporary profit-taking move and that the price is likely to rise higher again.

Specifically, we would like to buy at around USD 1970, the median line of the Bollinger Band. However, if the RSI is below 50, we plan to wait until it exceeds 50. If the price falls clearly below the median line and the median line turns into a resistance line, we will stop. Profit taking is expected near USD 1996 in the medium to long term and near USD 1980 in the short term.

Support and Resistance Lines

The resistance line to be considered in the future is as follows

1981 USD – Major resistance line
1970 USD – The middle line of the Bollinger Band

[XAUUSD / H1]

Market Sentiment

XAUUSD Sell: 78% Buy: 22%

Today’s Important Economic Indicators

Economic Indicators and EventsJST (Japan Standard Time)
British Consumer Prices Index15:00
EU Consumer Prices18:00
Mi Residential Construction Permits21:30

*Trading advice in this article is not provided by Milton Markets, but by Shu Fujiyasu Jr., a certified technical analyst.

Ready to trade?

Open live account

Related Analysis

USD/JPY dips slightly on LDP landslide victory

USD/JPY dips slightly on LDP landslide victory

8 days agoRead more →
Gold and Silver Continue to Hit Record Highs

Gold and Silver Continue to Hit Record Highs

20 days agoRead more →
USD/JPY: Selling Pressure Dominates on Rallies

USD/JPY: Selling Pressure Dominates on Rallies

7 days agoRead more →

This material is for informational purposes only and does not constitute investment advice. Trading leveraged products involves significant risk of loss. Past performance is not indicative of future results.

Share

X

Start trading today

  • Fast execution
  • Competitive spreads
  • 24/7 support
Open live accountView account types
Milton Markets
Twitter/XYouTube

Markets

FOREX
CRYPTO
COMMODITIES
INDICES
STOCKS

Trading

  • Flex Account
  • Smart Account
  • Elite Account
  • MetaTrader 5 (MT5)
  • MetaTrader 4 (MT4)
  • Launch WebTrader
  • Learn Hub
  • Economic Calendar
  • Promotions

Company

  • About Us
  • NDD Technology
  • Customer Protection
  • Execution Conditions
  • Company News
  • Blog
  • Market Analysis

Partners

  • IB Program
  • PAMM Program
  • White Label
  • Investor Login
  • Manager Login

Support

  • Terms of Service
  • Privacy Policy
  • Risk Disclosure
  • Contact Us
  • Help Center
  • My Page Login
Milton Markets is a trading name of Milton Markets Ltd. Milton Markets Ltd. is part of Milton Global and is registered in Saint Lucia (Registration Number: 2023-00166). As part of Milton Global, we adhere to the same high regulatory standards as Milton Global Ltd, which is regulated by the Seychelles Financial Services Authority (FSA) under license SD040.
Risk Warning: CFD trading carries high risk and may not suit all investors. You may lose more than your initial investment. Ensure you understand the risks before trading.
Restrictions: Milton Markets does not provide services to the following countries (not limited to these): United States, Canada, European Union countries, Iran, North Korea, Saint Vincent and the Grenadines, Afghanistan, American Samoa, Belarus, Russia, Burundi, Central African Republic, Congo (Brazzaville), Cuba, Iraq, Lebanon, Liberia, Libya, Myanmar, Puerto Rico, Rwanda, Somalia, Sudan, Syria, US Virgin Islands, Venezuela, Yemen, Zimbabwe, Côte d'Ivoire, Mali, Guinea, Eritrea.
You must be 18 years old or the legal age in your country of residence.
By opening an account, you are considered to have registered of your own volition without solicitation from Milton Markets.
Disclaimer: This website does not constitute investment advice. Content should not be construed as personal advice. Seek independent financial advice.
© 2026 Milton Markets. All rights reserved.
TermsPrivacyCookiesRisk