Milton Markets
Markets
Trading
Company
Partners
Sign InOpen Account
  1. Home/
  2. Market Analysis/
  3. Gold tests support at USD 1,900, selling pressure from continued high U.S. interest rate policy【August 16, 2023】
Koki Ando•Aug 16, 2023

Gold tests support at USD 1,900, selling pressure from continued high U.S. interest rate policy【August 16, 2023】

Koki Ando headshot

Daily Market Analysis

Koki AndoChief Market Analyst

Expert analysis of today's market movements and trading opportunities

Koki Ando headshot

Daily Market Analysis

Koki AndoChief Market Analyst

Expert analysis of today's market movements and trading opportunities

Fundamental Analysis

  • U.S. Retail Sales Beat Market Estimates, Signaling Resilience of U.S. Economy
  • U.S. PPI beat market expectations, indicating concern that high U.S. interest rates will remain high for a long period of time
  • Gold falls back to around USD 1900, with stop-losses involved and a drop in sight

XAUUSD Technical Analysis

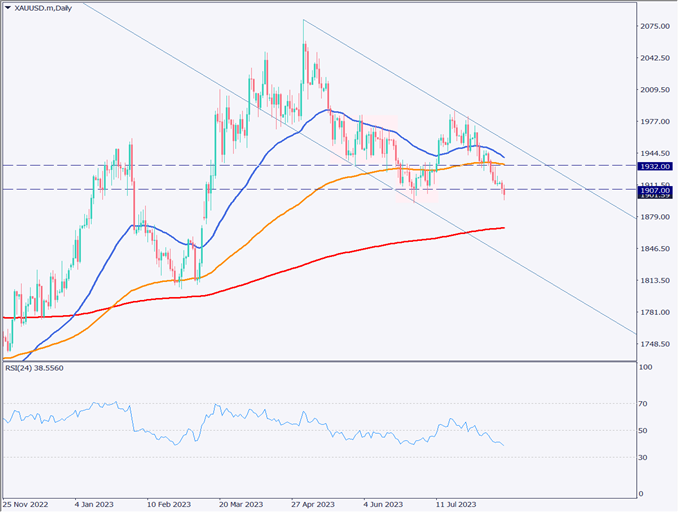
Analysis of the daily chart of Gold confirms a move below the milestone USD 1907 and temporarily below USD 1900. Technically, USD 1893 is located as an important support line, and this price is also noted as a recent low. A break below USD 1893 could result in a sharp drop to the lower line of the declining channel.

Although buying interest is seen near USD 1900, the fundamental backdrop suggests a continued state of selling pressure. Therefore, if the price breaks below USD 1893, the next support on a daily basis is likely to be USD 1867, where the 240 moving average is trending lower. Selling pressure, both fundamental and technical, should be watched carefully.

[XAUUSD / D1]

Day Trading Strategy (Hourly)

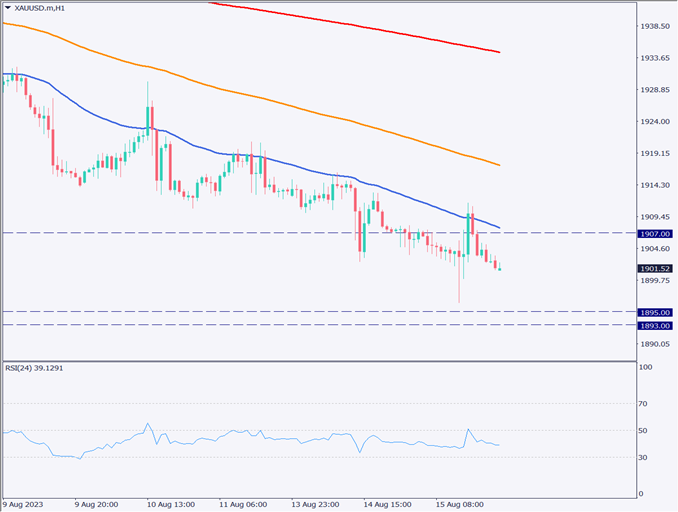
Analysis of the hourly chart of Gold confirms that the moving average is in the position of a perfect order and that a strong downtrend has been in place for an extended period of time. In particular, the short-term 24 moving averages are of particular interest, and there is little movement above this line. Fundamentally, gold is also susceptible to selling off due to the strong dollar.

Against this backdrop, our day trading strategy is to sell back. As a specific trading strategy, the entry price is set at USD 1907, the profit target at USD 1895, and the stop loss at USD 1910. If the RSI reaches around 30, we will close even if the price does not reach USD 1895.

Support and Resistance Lines

The resistance line to be considered in the future is as follows

1907 USD – Major resistance level
1895 USD – Major support zone

[XAUUSD / H1]

Market Sentiment

XAUUSD Sell: 23% Buy: 77%

Today’s Important Economic Indicators

Economic Indicators and EventsJST (Japan Standard Time)
EU GDP18:00
Number of Construction Permits21:30
Highlights of the FOMC MeetingNext day at 3:00

*Trading advice in this article is not provided by Milton Markets, but by Shu Fujiyasu Jr., a certified technical analyst.

Ready to trade?

Open live account

Related Analysis

USD/JPY dips slightly on LDP landslide victory

USD/JPY dips slightly on LDP landslide victory

8 days agoRead more →
USD/JPY Forms a Range — What’s Next?

USD/JPY Forms a Range — What’s Next?

1 day agoRead more →
Gold Remains in a Downtrend, $5,000 Acts as Strong Resistance

Gold Remains in a Downtrend, $5,000 Acts as Strong Resistance

TodayRead more →

This material is for informational purposes only and does not constitute investment advice. Trading leveraged products involves significant risk of loss. Past performance is not indicative of future results.

Share

X

Start trading today

  • Fast execution
  • Competitive spreads
  • 24/7 support
Open live accountView account types
Milton Markets
Twitter/XYouTube

Markets

FOREX
CRYPTO
COMMODITIES
INDICES
STOCKS

Trading

  • Flex Account
  • Smart Account
  • Elite Account
  • MetaTrader 5 (MT5)
  • MetaTrader 4 (MT4)
  • Launch WebTrader
  • Learn Hub
  • Economic Calendar
  • Promotions

Company

  • About Us
  • NDD Technology
  • Customer Protection
  • Execution Conditions
  • Company News
  • Blog
  • Market Analysis

Partners

  • IB Program
  • PAMM Program
  • White Label
  • Investor Login
  • Manager Login

Support

  • Terms of Service
  • Privacy Policy
  • Risk Disclosure
  • Contact Us
  • Help Center
  • My Page Login
Milton Markets is a trading name of Milton Markets Ltd. Milton Markets Ltd. is part of Milton Global and is registered in Saint Lucia (Registration Number: 2023-00166). As part of Milton Global, we adhere to the same high regulatory standards as Milton Global Ltd, which is regulated by the Seychelles Financial Services Authority (FSA) under license SD040.
Risk Warning: CFD trading carries high risk and may not suit all investors. You may lose more than your initial investment. Ensure you understand the risks before trading.
Restrictions: Milton Markets does not provide services to the following countries (not limited to these): United States, Canada, European Union countries, Iran, North Korea, Saint Vincent and the Grenadines, Afghanistan, American Samoa, Belarus, Russia, Burundi, Central African Republic, Congo (Brazzaville), Cuba, Iraq, Lebanon, Liberia, Libya, Myanmar, Puerto Rico, Rwanda, Somalia, Sudan, Syria, US Virgin Islands, Venezuela, Yemen, Zimbabwe, Côte d'Ivoire, Mali, Guinea, Eritrea.
You must be 18 years old or the legal age in your country of residence.
By opening an account, you are considered to have registered of your own volition without solicitation from Milton Markets.
Disclaimer: This website does not constitute investment advice. Content should not be construed as personal advice. Seek independent financial advice.
© 2026 Milton Markets. All rights reserved.
TermsPrivacyCookiesRisk