Milton Markets
Markets
Trading
Company
Partners
Sign InOpen Account
  1. Home/
  2. Market Analysis/
  3. USDJPY up for 8th straight day; USDJPY surges above JPY 146【August 17, 2023】
Koki Ando•Aug 17, 2023

USDJPY up for 8th straight day; USDJPY surges above JPY 146【August 17, 2023】

Koki Ando headshot

Daily Market Analysis

Koki AndoChief Market Analyst

Expert analysis of today's market movements and trading opportunities

Koki Ando headshot

Daily Market Analysis

Koki AndoChief Market Analyst

Expert analysis of today's market movements and trading opportunities

Fundamental Analysis

  • U.S. FOMC Minutes Show Hawkish Stance, Discussing Additional Rate Hikes This Year
  • Chinese stocks sharply lower, defaults by major Chinese real estate companies
  • Outflow of funds from China spurs buying of dollars as a safe-haven asset

USDJPY Technical Analysis

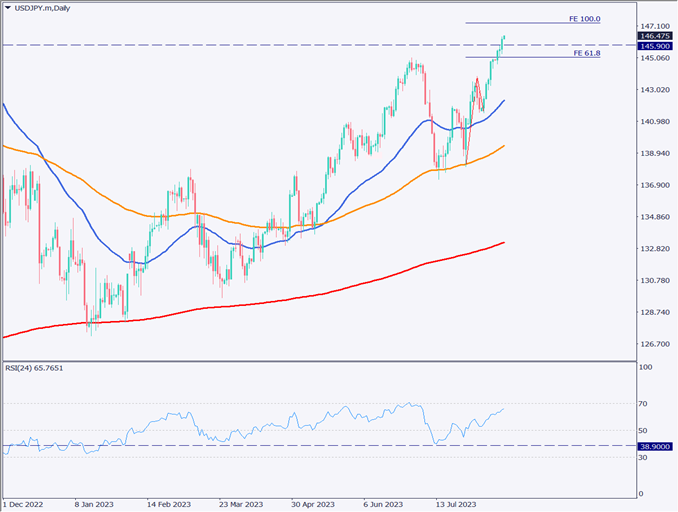
Analysis of the daily chart of the USDJPY shows that it has broken through the recent high of 145.90 JPY and has risen to the 146.40 JPY level. Currently, the daily chart shows an 8-day move, and there is no sign of currency intervention.

In terms of fundamentals, the discussion in the U.S. FOMC meeting minutes regarding the prospects for additional interest rate hikes before the end of the year can be considered a major factor. The hawkish stance expressed in the meeting has accelerated buying of the dollar. Furthermore, the deterioration of the Chinese economy may have increased the willingness to purchase the U.S. dollar as a safe-haven asset.

From a technical perspective, the next resistance line to watch is 147.30 JPY, which corresponds to 100% of the Fibonacci Expansion. Considering the current developments and fundamentals, the uptrend in the USD/JPY is likely to continue, but caution is needed for a reaction around 147.30 JPY.

[USDJPY / D1]

Day Trading Strategy (Hourly)

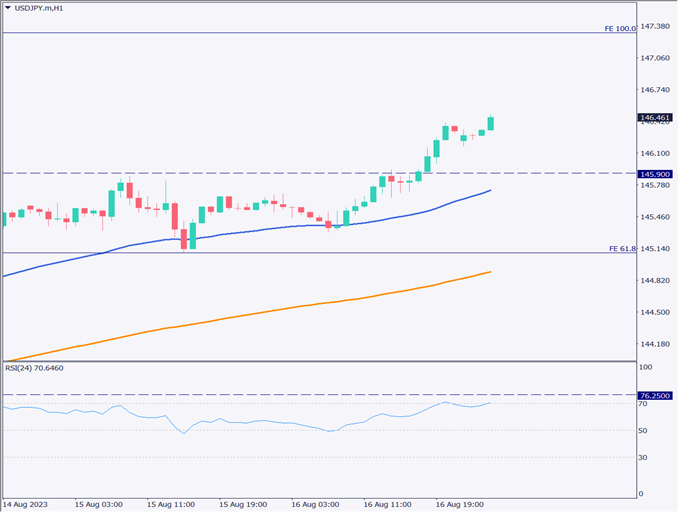
Analysis of the hourly chart of the USDJPY shows that the pair continued to rise based on the rebound at the 24 moving averages, gradually moving away from the MAs. The break above the 146.40 JPY level clearly indicates the onset of an uptrend, even for a short period of time.

However, with the RSI located at around 70, we need to be wary of the possibility of an adjustment sell-off. In particular, the recent high for the RSI is 76.25, and if the RSI rises to around this value, the risk of a selloff increases.

As for day trading strategy, the policy is to buy on the push side. The entry price is set at 145.90 JPY and the settlement target is 147.30 JPY. Meanwhile, the stop loss is set at 145.50 JPY. The upward movement is clear and we would like to follow the trend.

Support and Resistance Lines

The resistance line to be considered in the future is as follows

145.90 JPY -Major support line

[USDJPY / H1]

Market Sentiment

USDJPY Sell: 76% Buy: 24%

Today’s Important Economic Indicators

Economic Indicators and EventsJST (Japan Standard Time)
Australian Employment Statistics10:30

*Trading advice in this article is not provided by Milton Markets, but by Shu Fujiyasu Jr., a certified technical analyst.

Ready to trade?

Open live account

Related Analysis

USD/JPY dips slightly on LDP landslide victory

USD/JPY dips slightly on LDP landslide victory

8 days agoRead more →
USD/JPY Forms a Range — What’s Next?

USD/JPY Forms a Range — What’s Next?

1 day agoRead more →
Gold Remains in a Downtrend, $5,000 Acts as Strong Resistance

Gold Remains in a Downtrend, $5,000 Acts as Strong Resistance

TodayRead more →

This material is for informational purposes only and does not constitute investment advice. Trading leveraged products involves significant risk of loss. Past performance is not indicative of future results.

Share

X

Start trading today

  • Fast execution
  • Competitive spreads
  • 24/7 support
Open live accountView account types
Milton Markets
Twitter/XYouTube

Markets

FOREX
CRYPTO
COMMODITIES
INDICES
STOCKS

Trading

  • Flex Account
  • Smart Account
  • Elite Account
  • MetaTrader 5 (MT5)
  • MetaTrader 4 (MT4)
  • Launch WebTrader
  • Learn Hub
  • Economic Calendar
  • Promotions

Company

  • About Us
  • NDD Technology
  • Customer Protection
  • Execution Conditions
  • Company News
  • Blog
  • Market Analysis

Partners

  • IB Program
  • PAMM Program
  • White Label
  • Investor Login
  • Manager Login

Support

  • Terms of Service
  • Privacy Policy
  • Risk Disclosure
  • Contact Us
  • Help Center
  • My Page Login
Milton Markets is a trading name of Milton Markets Ltd. Milton Markets Ltd. is part of Milton Global and is registered in Saint Lucia (Registration Number: 2023-00166). As part of Milton Global, we adhere to the same high regulatory standards as Milton Global Ltd, which is regulated by the Seychelles Financial Services Authority (FSA) under license SD040.
Risk Warning: CFD trading carries high risk and may not suit all investors. You may lose more than your initial investment. Ensure you understand the risks before trading.
Restrictions: Milton Markets does not provide services to the following countries (not limited to these): United States, Canada, European Union countries, Iran, North Korea, Saint Vincent and the Grenadines, Afghanistan, American Samoa, Belarus, Russia, Burundi, Central African Republic, Congo (Brazzaville), Cuba, Iraq, Lebanon, Liberia, Libya, Myanmar, Puerto Rico, Rwanda, Somalia, Sudan, Syria, US Virgin Islands, Venezuela, Yemen, Zimbabwe, Côte d'Ivoire, Mali, Guinea, Eritrea.
You must be 18 years old or the legal age in your country of residence.
By opening an account, you are considered to have registered of your own volition without solicitation from Milton Markets.
Disclaimer: This website does not constitute investment advice. Content should not be construed as personal advice. Seek independent financial advice.
© 2026 Milton Markets. All rights reserved.
TermsPrivacyCookiesRisk