Milton Markets
Markets
Trading
Company
Partners
Sign InOpen Account
  1. Home/
  2. Market Analysis/
  3. Gold Recovers to USD 1920, Will It Break Out of the Downward Channel?【August 29, 2023】
Koki Ando•Aug 29, 2023

Gold Recovers to USD 1920, Will It Break Out of the Downward Channel?【August 29, 2023】

Koki Ando headshot

Daily Market Analysis

Koki AndoChief Market Analyst

Expert analysis of today's market movements and trading opportunities

Koki Ando headshot

Daily Market Analysis

Koki AndoChief Market Analyst

Expert analysis of today's market movements and trading opportunities

Fundamental Analysis

  • Jackson Hole Meeting Speech by Chairman Powell Passes without a Whimper
  • Market awaits U.S. jobs report, continues to search for direction
  • Gold’s focus is on whether it will break above the descending channel

XADUSD Technical Analysis

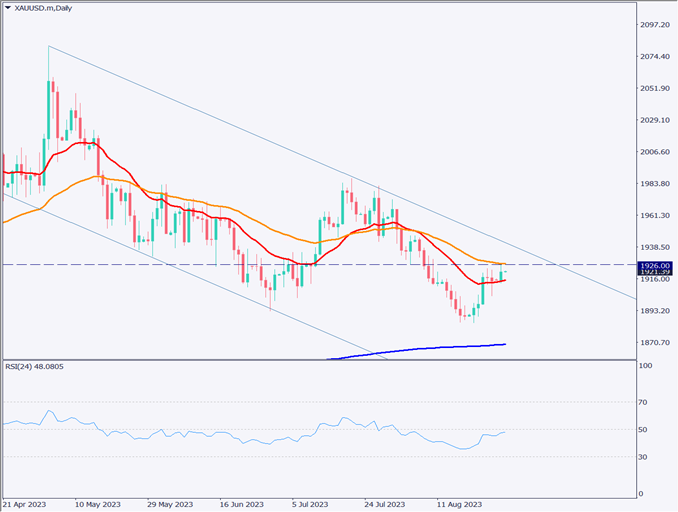
Analysis of the daily chart of the gold market shows that it is in a descending channel and the downtrend is continuing. Fed Chairman Powell was somewhat cautious about additional rate hikes, but his speech was still hinting at a rate hike.
This allowed Gold to recover to $1920, with the RSI hovering around 50, indicating a close.

Gold is also above its 10-moving average, but the 24-moving average is resistance. This indicates that a short-term uptrend may have begun, but a medium-term trend reversal has yet to occur.

The key point going forward is whether the 24 moving averages are breached and the RSI exceeds 50. If these conditions are met, a shift to an uptrend can be expected. Conversely, if the 24-moving average is not breached and the RSI turns downward, a resumption of the downtrend is likely.

[XAUUSD / D1]

Day Trading Strategy (Hourly)

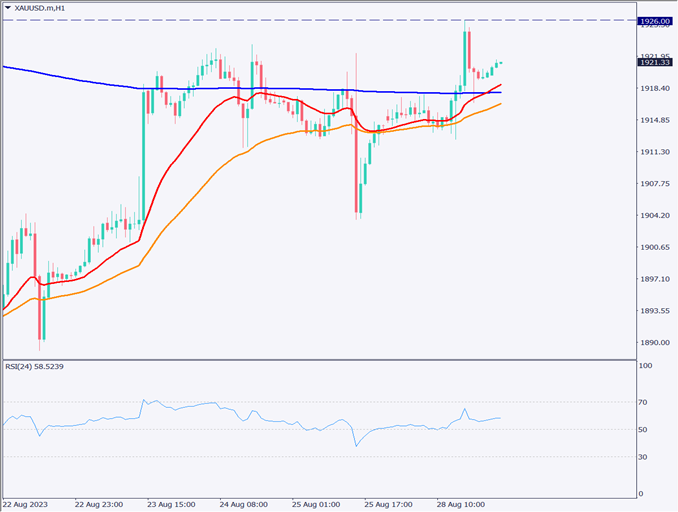
Analyzing the hourly chart of the gold market, we believe that the market is above the 10, 24, and 240 moving averages and that the upward trend is continuing in the short term. However, the daily resistance line at $1926 is formidable. Market sentiment is also approaching a state of positional tilt, and we expect a one-sided sense of direction to be difficult to find for some time. Especially with the upcoming employment data release, cautious trading is called for.

Our trading policy is range trading. Specifically, we aim to push the price near the 240 moving average, with a close at $1926 and a stop at $1916. However, we need to pay close attention to the release of the employment report and other event risks.

Support and Resistance Lines

The resistance line to be considered in the future is as follows

1926 USD – Major resistance line
1919.66 USD – Pivot point

[XAUUSD / H1]

Market Sentiment

XAUUSD Sell: 56% Buy: 44%

Today’s Important Economic Indicators

Economic Indicators and EventsJST (Japan Standard Time)
Employment Statistics for the Day8:30
U.S. Consumer Confidence Index23:00

*Trading advice in this article is not provided by Milton Markets, but by Shu Fujiyasu Jr., a certified technical analyst.

Ready to trade?

Open live account

Related Analysis

Gold Remains in a Downtrend, $5,000 Acts as Strong Resistance

Gold Remains in a Downtrend, $5,000 Acts as Strong Resistance

TodayRead more →
USD/JPY Forms a Range — What’s Next?

USD/JPY Forms a Range — What’s Next?

1 day agoRead more →
Gold and Silver Continue to Hit Record Highs

Gold and Silver Continue to Hit Record Highs

20 days agoRead more →

This material is for informational purposes only and does not constitute investment advice. Trading leveraged products involves significant risk of loss. Past performance is not indicative of future results.

Share

X

Start trading today

  • Fast execution
  • Competitive spreads
  • 24/7 support
Open live accountView account types
Milton Markets
Twitter/XYouTube

Markets

FOREX
CRYPTO
COMMODITIES
INDICES
STOCKS

Trading

  • Flex Account
  • Smart Account
  • Elite Account
  • MetaTrader 5 (MT5)
  • MetaTrader 4 (MT4)
  • Launch WebTrader
  • Learn Hub
  • Economic Calendar
  • Promotions

Company

  • About Us
  • NDD Technology
  • Customer Protection
  • Execution Conditions
  • Company News
  • Blog
  • Market Analysis

Partners

  • IB Program
  • PAMM Program
  • White Label
  • Investor Login
  • Manager Login

Support

  • Terms of Service
  • Privacy Policy
  • Risk Disclosure
  • Contact Us
  • Help Center
  • My Page Login
Milton Markets is a trading name of Milton Markets Ltd. Milton Markets Ltd. is part of Milton Global and is registered in Saint Lucia (Registration Number: 2023-00166). As part of Milton Global, we adhere to the same high regulatory standards as Milton Global Ltd, which is regulated by the Seychelles Financial Services Authority (FSA) under license SD040.
Risk Warning: CFD trading carries high risk and may not suit all investors. You may lose more than your initial investment. Ensure you understand the risks before trading.
Restrictions: Milton Markets does not provide services to the following countries (not limited to these): United States, Canada, European Union countries, Iran, North Korea, Saint Vincent and the Grenadines, Afghanistan, American Samoa, Belarus, Russia, Burundi, Central African Republic, Congo (Brazzaville), Cuba, Iraq, Lebanon, Liberia, Libya, Myanmar, Puerto Rico, Rwanda, Somalia, Sudan, Syria, US Virgin Islands, Venezuela, Yemen, Zimbabwe, Côte d'Ivoire, Mali, Guinea, Eritrea.
You must be 18 years old or the legal age in your country of residence.
By opening an account, you are considered to have registered of your own volition without solicitation from Milton Markets.
Disclaimer: This website does not constitute investment advice. Content should not be construed as personal advice. Seek independent financial advice.
© 2026 Milton Markets. All rights reserved.
TermsPrivacyCookiesRisk