Milton Markets
Markets
Trading
Company
Partners
Sign InOpen Account
  1. Home/
  2. Market Analysis/
  3. Divergence appears in the USDJPY, weakening upward momentum【September 11, 2023】
Koki Ando•Sep 11, 2023

Divergence appears in the USDJPY, weakening upward momentum【September 11, 2023】

Koki Ando headshot

Daily Market Analysis

Koki AndoChief Market Analyst

Expert analysis of today's market movements and trading opportunities

Koki Ando headshot

Daily Market Analysis

Koki AndoChief Market Analyst

Expert analysis of today's market movements and trading opportunities

Fundamental Analysis

  • The pair fell through a window to 146.60 JPY early in the morning, with the possibility of a window-filling move
  • BOJ Governor says data will be available by the end of the year to assess price trends
  • Yen strengthens on expectations of BOJ policy normalization, divergence emerges in USD/JPY

USDJPY Technical Analysis

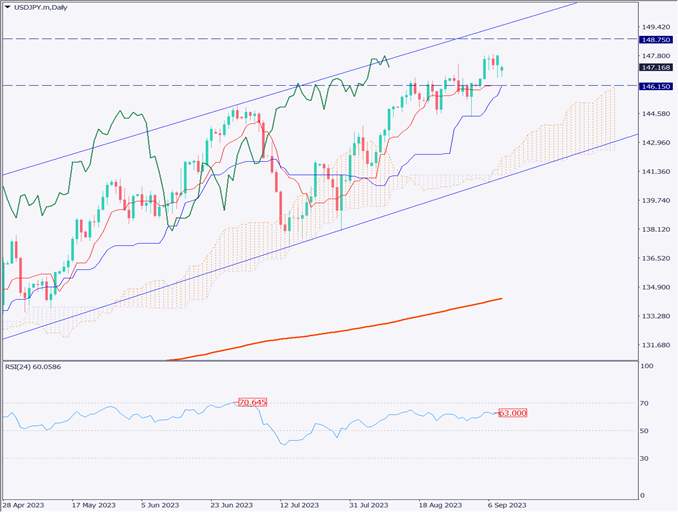
Analyze the daily chart of the USD/JPY market. The dollar index has rallied for eight consecutive weeks, suggesting overheating. This overheating is increasing the possibility that the dollar buying trend will weaken, and the USD/JPY may enter an adjustment phase.

A possible target for adjustment is 146.15 JPY. At this level, the Ichimoku Kinko Chart’s conversion line and base line overlap and are likely to function as a solid support band. Furthermore, divergence can be seen in the RSI, which should be watched closely as a sign of a future change in tone, especially a decline.

[USDJPY / D1]

Day Trading Strategy (Hourly)

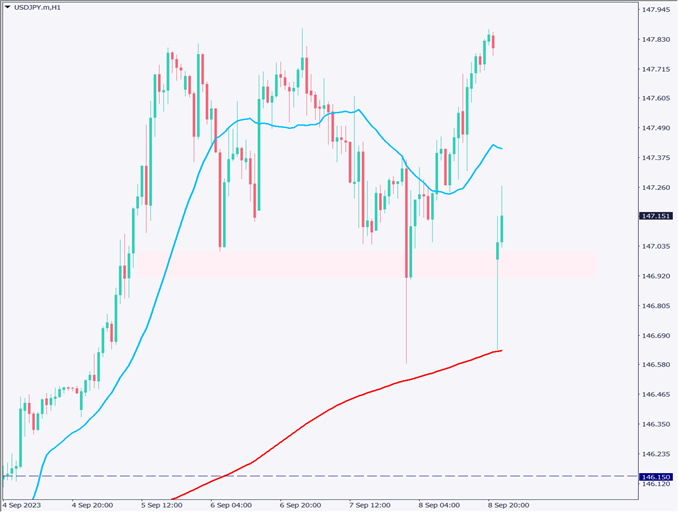
Analyze the hourly chart of the USDJPY market. It shows a window opening and a sharp drop to the latter half of 146 JPY. After such a window-opening, the window is often filled in the morning of Tokyo time, and this is likely to be the case this time as well.

The area around 146.90-147 JPY is likely to act as a resistance zone, as it has seen reactions in past trades. Furthermore, the 240 moving average is also located nearby, and a reaction with this line in mind is expected. The dollar index is overheated, which could lead to sharp fluctuations in currency strength.

As for trading policy, it would be better to aim to buy at a deep push and consider a short settlement. Entry points are 146.90 JPY, 146.65 JPY, and 146.15 JPY, with a stop at 145.90 JPY and a target price of 148.86 JPY.

Support and Resistance Lines

The resistance line to be considered in the future is as follows

147.00 JPY – Neckline
146.15 JPY – Support line for technical indicators

[USDJPY / H1]

Market Sentiment

USDJPY Sell: 71% Buy: 29%

Today’s Important Economic Indicators

Economic Indicators and EventsJST (Japan Standard Time)
None in particular–

*Trading advice in this article is not provided by Milton Markets, but by Shu Fujiyasu Jr., a certified technical analyst.

Ready to trade?

Open live account

Related Analysis

Can Gold Renew Its Record High?

Can Gold Renew Its Record High?

11 days agoRead more →
Gold Remains in a Downtrend, $5,000 Acts as Strong Resistance

Gold Remains in a Downtrend, $5,000 Acts as Strong Resistance

TodayRead more →
USD/JPY Forms a Range — What’s Next?

USD/JPY Forms a Range — What’s Next?

1 day agoRead more →

This material is for informational purposes only and does not constitute investment advice. Trading leveraged products involves significant risk of loss. Past performance is not indicative of future results.

Share

X

Start trading today

  • Fast execution
  • Competitive spreads
  • 24/7 support
Open live accountView account types
Milton Markets
Twitter/XYouTube

Markets

FOREX
CRYPTO
COMMODITIES
INDICES
STOCKS

Trading

  • Flex Account
  • Smart Account
  • Elite Account
  • MetaTrader 5 (MT5)
  • MetaTrader 4 (MT4)
  • Launch WebTrader
  • Learn Hub
  • Economic Calendar
  • Promotions

Company

  • About Us
  • NDD Technology
  • Customer Protection
  • Execution Conditions
  • Company News
  • Blog
  • Market Analysis

Partners

  • IB Program
  • PAMM Program
  • White Label
  • Investor Login
  • Manager Login

Support

  • Terms of Service
  • Privacy Policy
  • Risk Disclosure
  • Contact Us
  • Help Center
  • My Page Login
Milton Markets is a trading name of Milton Markets Ltd. Milton Markets Ltd. is part of Milton Global and is registered in Saint Lucia (Registration Number: 2023-00166). As part of Milton Global, we adhere to the same high regulatory standards as Milton Global Ltd, which is regulated by the Seychelles Financial Services Authority (FSA) under license SD040.
Risk Warning: CFD trading carries high risk and may not suit all investors. You may lose more than your initial investment. Ensure you understand the risks before trading.
Restrictions: Milton Markets does not provide services to the following countries (not limited to these): United States, Canada, European Union countries, Iran, North Korea, Saint Vincent and the Grenadines, Afghanistan, American Samoa, Belarus, Russia, Burundi, Central African Republic, Congo (Brazzaville), Cuba, Iraq, Lebanon, Liberia, Libya, Myanmar, Puerto Rico, Rwanda, Somalia, Sudan, Syria, US Virgin Islands, Venezuela, Yemen, Zimbabwe, Côte d'Ivoire, Mali, Guinea, Eritrea.
You must be 18 years old or the legal age in your country of residence.
By opening an account, you are considered to have registered of your own volition without solicitation from Milton Markets.
Disclaimer: This website does not constitute investment advice. Content should not be construed as personal advice. Seek independent financial advice.
© 2026 Milton Markets. All rights reserved.
TermsPrivacyCookiesRisk