Milton Markets
Markets
Trading
Company
Partners
Sign InOpen Account
  1. Home/
  2. Market Analysis/
  3. Gold Declines, Breaks Downward Out of Triangle【September 27, 2023】
Koki Ando•Sep 27, 2023

Gold Declines, Breaks Downward Out of Triangle【September 27, 2023】

Koki Ando headshot

Daily Market Analysis

Koki AndoChief Market Analyst

Expert analysis of today's market movements and trading opportunities

Koki Ando headshot

Daily Market Analysis

Koki AndoChief Market Analyst

Expert analysis of today's market movements and trading opportunities

Fundamental Analysis

  • U.S. Consumer Confidence Index deteriorates, causing a significant drop in stock prices.
  • Concerns arise over stagflation, with inflation and high interest rates occurring simultaneously.
  • Focus on whether gold can maintain its support at USD 1900.

XAUUSD Technical Analysis

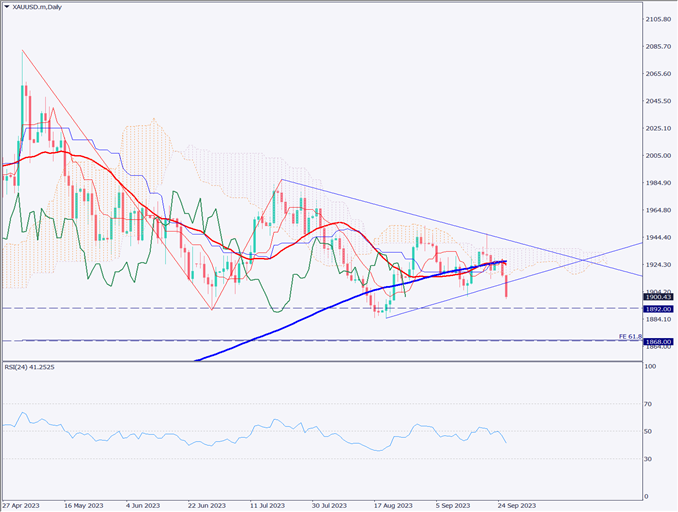
Analyzing the daily chart for gold, it has broken downwards from the lower line of its triangle formation. This movement can be attributed to the deterioration of the U.S. Consumer Confidence Index. On the support side, there is a strong band around USD 1892.

Furthermore, using Fibonacci expansion for analysis, it is confirmed that USD 1868 corresponds to the 61.8% level. Based on this information, gold’s price movement in October is expected to fluctuate between USD 1850 and USD 1900.

[XAUUSD / D1]

Day Trading Strategy (Hourly)

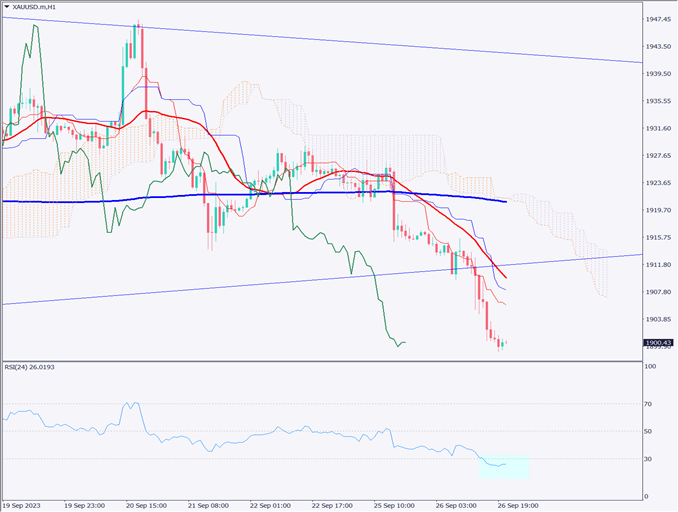
Analyzing the 1-hour chart for gold, the RSI is currently situated around 26, suggesting a potential rebound when it surpasses 30 again. As the trend strengthens, the Ichimoku Kinko Hyo’s conversion line often plays the role of a resistance line.

In the short term, a rebound up to USD 1904 is anticipated. Considering the moving average, a recovery up to USD 1908 is also conceivable. However, the overall trend of a stronger dollar remains unchanged, making it appropriate to sell once the price rebounds.

Specifically, the trading strategy is to sell on the bounce. Entry point: USD 1906, stop: USD 1910, target exit point: USD 1894.

Support and Resistance Lines

The resistance line to be considered in the future is as follows

1900 USD – Round number.
1892 USD – Monthly support line.

[XAUUSD/ H1]

Market Sentiment

XAUUSD Sell: 14% Buy: 86%

Today’s Important Economic Indicators

Economic Indicators and EventsJST (Japan Standard Time)
Summary of the Bank of Japan’s Monetary Policy Meeting8:50
U.S. Core Durable Goods Orders21:30
Crude Oil Inventor23:30

*Trading advice in this article is not provided by Milton Markets, but by Shu Fujiyasu Jr., a certified technical analyst.

Ready to trade?

Open live account

Related Analysis

USD/JPY Forms a Range — What’s Next?

USD/JPY Forms a Range — What’s Next?

1 day agoRead more →
Gold Remains in a Downtrend, $5,000 Acts as Strong Resistance

Gold Remains in a Downtrend, $5,000 Acts as Strong Resistance

TodayRead more →
Gold and Silver Continue to Hit Record Highs

Gold and Silver Continue to Hit Record Highs

20 days agoRead more →

This material is for informational purposes only and does not constitute investment advice. Trading leveraged products involves significant risk of loss. Past performance is not indicative of future results.

Share

X

Start trading today

  • Fast execution
  • Competitive spreads
  • 24/7 support
Open live accountView account types
Milton Markets
Twitter/XYouTube

Markets

FOREX
CRYPTO
COMMODITIES
INDICES
STOCKS

Trading

  • Flex Account
  • Smart Account
  • Elite Account
  • MetaTrader 5 (MT5)
  • MetaTrader 4 (MT4)
  • Launch WebTrader
  • Learn Hub
  • Economic Calendar
  • Promotions

Company

  • About Us
  • NDD Technology
  • Customer Protection
  • Execution Conditions
  • Company News
  • Blog
  • Market Analysis

Partners

  • IB Program
  • PAMM Program
  • White Label
  • Investor Login
  • Manager Login

Support

  • Terms of Service
  • Privacy Policy
  • Risk Disclosure
  • Contact Us
  • Help Center
  • My Page Login
Milton Markets is a trading name of Milton Markets Ltd. Milton Markets Ltd. is part of Milton Global and is registered in Saint Lucia (Registration Number: 2023-00166). As part of Milton Global, we adhere to the same high regulatory standards as Milton Global Ltd, which is regulated by the Seychelles Financial Services Authority (FSA) under license SD040.
Risk Warning: CFD trading carries high risk and may not suit all investors. You may lose more than your initial investment. Ensure you understand the risks before trading.
Restrictions: Milton Markets does not provide services to the following countries (not limited to these): United States, Canada, European Union countries, Iran, North Korea, Saint Vincent and the Grenadines, Afghanistan, American Samoa, Belarus, Russia, Burundi, Central African Republic, Congo (Brazzaville), Cuba, Iraq, Lebanon, Liberia, Libya, Myanmar, Puerto Rico, Rwanda, Somalia, Sudan, Syria, US Virgin Islands, Venezuela, Yemen, Zimbabwe, Côte d'Ivoire, Mali, Guinea, Eritrea.
You must be 18 years old or the legal age in your country of residence.
By opening an account, you are considered to have registered of your own volition without solicitation from Milton Markets.
Disclaimer: This website does not constitute investment advice. Content should not be construed as personal advice. Seek independent financial advice.
© 2026 Milton Markets. All rights reserved.
TermsPrivacyCookiesRisk