Milton Markets
Markets
Trading
Company
Partners
Sign InOpen Account
  1. Home/
  2. Market Analysis/
  3. EUR/USD Continues to Decline, Approaching the Key Level of 1.0500【September 28, 2023】
Koki Ando•Sep 28, 2023

EUR/USD Continues to Decline, Approaching the Key Level of 1.0500【September 28, 2023】

Koki Ando headshot

Daily Market Analysis

Koki AndoChief Market Analyst

Expert analysis of today's market movements and trading opportunities

Koki Ando headshot

Daily Market Analysis

Koki AndoChief Market Analyst

Expert analysis of today's market movements and trading opportunities

Fundamental Analysis

  • Significant decline in EUR/USD, dropping for the 11th consecutive week.
  • With economic slowdown in the EU and the end of interest rate hikes, funds are flowing more easily into the USD.
  • It might take some time before the price goes below 1.05 dollars.

EURUSD Technical Analysis

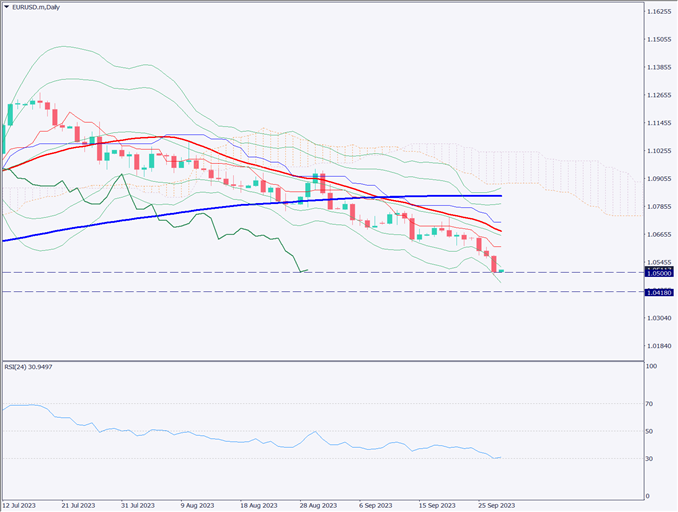
Analyzing the daily chart of EUR/USD, we can confirm that it is moving between the -2σ to -3σ of the Bollinger Bands. Despite the downtrend, the RSI is hovering around 30, suggesting potential for a bounce back.

The price is nearing the round number of 1.05 dollars, and it’s expected that there are many buy limit orders placed. Observing market sentiment, 91% are on the buying side, suggesting the need for caution against sudden price fluctuations. A return to the level near the conversion line of the Ichimoku Cloud is also possible.

One reason for this trend is the end of interest rate hikes by the ECB, making it easier for funds to flow into the USD.

[EURUSD / D1]

Day Trading Strategy (Hourly)

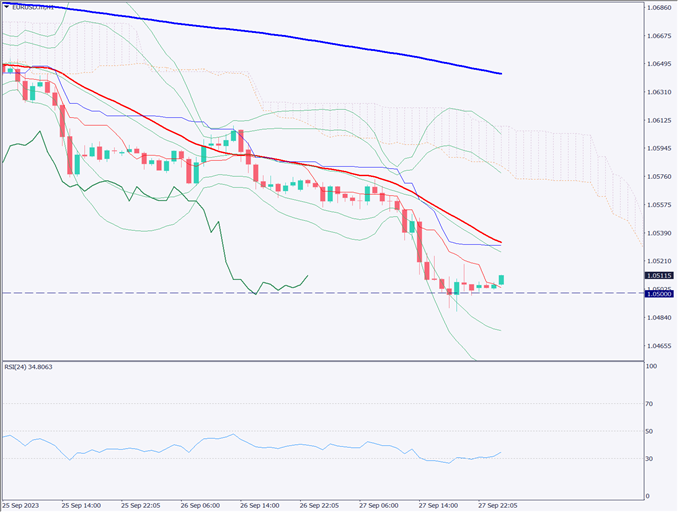
Analyzing the 1-hour chart, there’s evidence of buy orders after the price dropped below 1.05 dollars, leading to a bounce. RSI has also risen from 26 to 35, indicating a potential return to the 24-period moving average. A recovery to around 1.0535 dollars is anticipated.

Fundamentally, the market conditions favoring the USD due to potential further rate hikes remain unchanged, suggesting a resurgence in selling pressure. While caution is needed at the end of the month, a bearish stance is preferable. Look out for moments when the RSI reaches 50 and then resumes a downward trend.

The day trade approach is to sell on rallies. Entry is anticipated around 1.0535 dollars. Exit is expected around 1.0418 dollars. A stop is considered at 1.0555 dollars.

Support and Resistance Lines

The resistance line to be considered in the future is as follows

1.05 USD – An important round number milestone.
1.0418 USD – Monthly support line.

[EURUSD/ H1]

Market Sentiment

EURUSD Sell: 9% Buy: 91%

Today’s Important Economic Indicators

Economic Indicators and EventsJST (Japan Standard Time)
Australia Retail Sales10:30
European Central Bank Economic Report17:00
German Consumer Price Index21:00
US Gross Domestic Product (GDP)21:30

*Trading advice in this article is not provided by Milton Markets, but by Shu Fujiyasu Jr., a certified technical analyst.

Ready to trade?

Open live account

Related Analysis

Gold Remains in a Downtrend, $5,000 Acts as Strong Resistance

Gold Remains in a Downtrend, $5,000 Acts as Strong Resistance

TodayRead more →
Can Gold Renew Its Record High?

Can Gold Renew Its Record High?

11 days agoRead more →
USD/JPY dips slightly on LDP landslide victory

USD/JPY dips slightly on LDP landslide victory

8 days agoRead more →

This material is for informational purposes only and does not constitute investment advice. Trading leveraged products involves significant risk of loss. Past performance is not indicative of future results.

Share

X

Start trading today

  • Fast execution
  • Competitive spreads
  • 24/7 support
Open live accountView account types
Milton Markets
Twitter/XYouTube

Markets

FOREX
CRYPTO
COMMODITIES
INDICES
STOCKS

Trading

  • Flex Account
  • Smart Account
  • Elite Account
  • MetaTrader 5 (MT5)
  • MetaTrader 4 (MT4)
  • Launch WebTrader
  • Learn Hub
  • Economic Calendar
  • Promotions

Company

  • About Us
  • NDD Technology
  • Customer Protection
  • Execution Conditions
  • Company News
  • Blog
  • Market Analysis

Partners

  • IB Program
  • PAMM Program
  • White Label
  • Investor Login
  • Manager Login

Support

  • Terms of Service
  • Privacy Policy
  • Risk Disclosure
  • Contact Us
  • Help Center
  • My Page Login
Milton Markets is a trading name of Milton Markets Ltd. Milton Markets Ltd. is part of Milton Global and is registered in Saint Lucia (Registration Number: 2023-00166). As part of Milton Global, we adhere to the same high regulatory standards as Milton Global Ltd, which is regulated by the Seychelles Financial Services Authority (FSA) under license SD040.
Risk Warning: CFD trading carries high risk and may not suit all investors. You may lose more than your initial investment. Ensure you understand the risks before trading.
Restrictions: Milton Markets does not provide services to the following countries (not limited to these): United States, Canada, European Union countries, Iran, North Korea, Saint Vincent and the Grenadines, Afghanistan, American Samoa, Belarus, Russia, Burundi, Central African Republic, Congo (Brazzaville), Cuba, Iraq, Lebanon, Liberia, Libya, Myanmar, Puerto Rico, Rwanda, Somalia, Sudan, Syria, US Virgin Islands, Venezuela, Yemen, Zimbabwe, Côte d'Ivoire, Mali, Guinea, Eritrea.
You must be 18 years old or the legal age in your country of residence.
By opening an account, you are considered to have registered of your own volition without solicitation from Milton Markets.
Disclaimer: This website does not constitute investment advice. Content should not be construed as personal advice. Seek independent financial advice.
© 2026 Milton Markets. All rights reserved.
TermsPrivacyCookiesRisk