Milton Markets
Markets
Trading
Company
Partners
Sign InOpen Account
  1. Home/
  2. Market Analysis/
  3. Gold Surges Since March, Escalating Concerns Near Israel【October 16, 2023】
Koki Ando•Oct 16, 2023

Gold Surges Since March, Escalating Concerns Near Israel【October 16, 2023】

Koki Ando headshot

Daily Market Analysis

Koki AndoChief Market Analyst

Expert analysis of today's market movements and trading opportunities

Koki Ando headshot

Daily Market Analysis

Koki AndoChief Market Analyst

Expert analysis of today's market movements and trading opportunities

Fundamental Analysis

  • The situation in Israel intensifies as preparations for a ground invasion into the Gaza Strip are underway. 
  • Saudi Arabia halts normalization of relations with Israel, leading to a strong backlash from Iran. 
  • Safe-haven assets see increased inflows, with Gold and the Swiss Franc notably in demand.

XAUUSD Technical Analysis

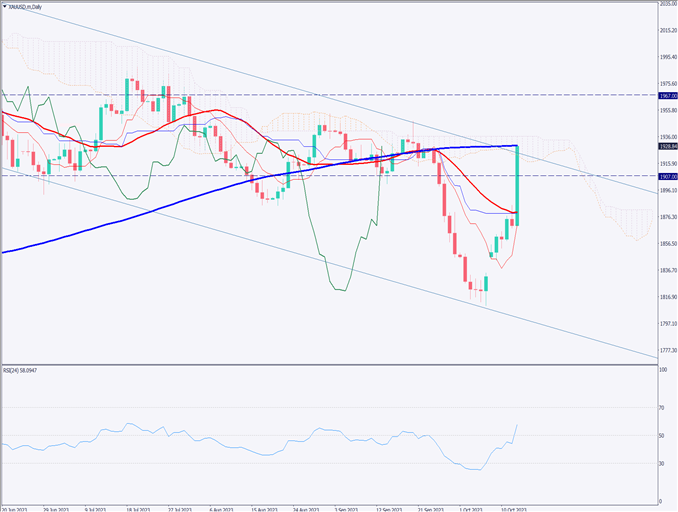
Analyzing the daily chart of Gold prices, it currently approaches the 240-day moving average while exhibiting movement near the upper band of a descending channel. The Ichimoku Cloud’s lagging line has crossed above the candlesticks.

From a technical standpoint, a potential pullback is possible at this juncture, but the current dynamics are largely driven by fundamentals. Especially if conflicts around Israel escalate, an uptrend in Gold is anticipated. Reactions from Middle Eastern nations, fluctuations in US Treasury yields, and the dovish stance of US financial authorities are all factors that can influence Gold prices.

[XAUUSD / D1]

Day Trading Strategy (Hourly)

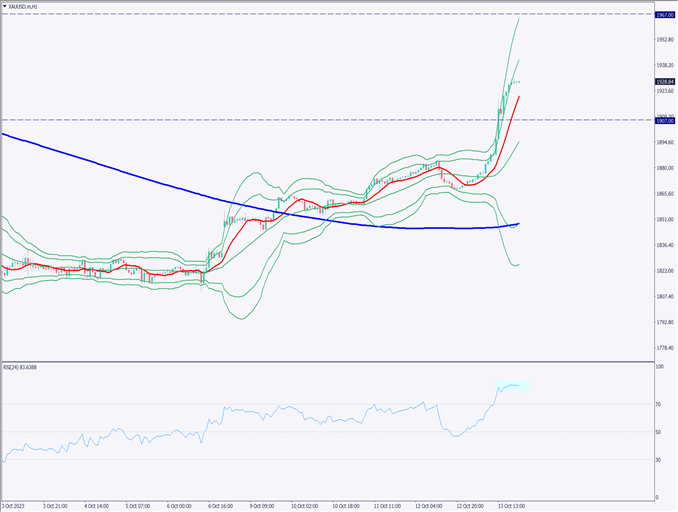
Examining the daily chart of Gold prices, Gold is currently on the rise within a highly volatile environment. The 1-hour RSI has reached 85, suggesting the possibility of profit-taking selling once it drops below 70. However, in this situation, a drop below 70 may not immediately be interpreted as a selling signal.

To ride the uptrend, it’s advisable to wait for pullbacks before buying. $1,907 is likely to serve as a significant support level. Quick entries from the current stage should be avoided. As a day trading guideline, consider buying after the RSI drops below 70 and a correction has occurred. Entry at USD 1,907, exit at USD1,967, and stop loss at USD1,895.

Support and Resistance Lines

The resistance line to be considered in the future is as follows

1,967 USD: Monthly resistance line
1,948 USD: Historical major resistance line

[XUAUSD/ H1]

Market Sentiment

XAUUSD Sell: 77% Buy: 23%

Today’s Important Economic Indicators

Economic Indicators and EventsJST (Japan Standard Time)
Industrial Production in Japan13:30
NY Fed Manufacturing Index21:30
FOMC Member Speeches23:30

*Trading advice in this article is not provided by Milton Markets, but by Shu Fujiyasu Jr., a certified technical analyst.

Ready to trade?

Open live account

Related Analysis

Gold Remains in a Downtrend, $5,000 Acts as Strong Resistance

Gold Remains in a Downtrend, $5,000 Acts as Strong Resistance

TodayRead more →
USD/JPY Forms a Range — What’s Next?

USD/JPY Forms a Range — What’s Next?

1 day agoRead more →
USD/JPY dips slightly on LDP landslide victory

USD/JPY dips slightly on LDP landslide victory

8 days agoRead more →

This material is for informational purposes only and does not constitute investment advice. Trading leveraged products involves significant risk of loss. Past performance is not indicative of future results.

Share

X

Start trading today

  • Fast execution
  • Competitive spreads
  • 24/7 support
Open live accountView account types
Milton Markets
Twitter/XYouTube

Markets

FOREX
CRYPTO
COMMODITIES
INDICES
STOCKS

Trading

  • Flex Account
  • Smart Account
  • Elite Account
  • MetaTrader 5 (MT5)
  • MetaTrader 4 (MT4)
  • Launch WebTrader
  • Learn Hub
  • Economic Calendar
  • Promotions

Company

  • About Us
  • NDD Technology
  • Customer Protection
  • Execution Conditions
  • Company News
  • Blog
  • Market Analysis

Partners

  • IB Program
  • PAMM Program
  • White Label
  • Investor Login
  • Manager Login

Support

  • Terms of Service
  • Privacy Policy
  • Risk Disclosure
  • Contact Us
  • Help Center
  • My Page Login
Milton Markets is a trading name of Milton Markets Ltd. Milton Markets Ltd. is part of Milton Global and is registered in Saint Lucia (Registration Number: 2023-00166). As part of Milton Global, we adhere to the same high regulatory standards as Milton Global Ltd, which is regulated by the Seychelles Financial Services Authority (FSA) under license SD040.
Risk Warning: CFD trading carries high risk and may not suit all investors. You may lose more than your initial investment. Ensure you understand the risks before trading.
Restrictions: Milton Markets does not provide services to the following countries (not limited to these): United States, Canada, European Union countries, Iran, North Korea, Saint Vincent and the Grenadines, Afghanistan, American Samoa, Belarus, Russia, Burundi, Central African Republic, Congo (Brazzaville), Cuba, Iraq, Lebanon, Liberia, Libya, Myanmar, Puerto Rico, Rwanda, Somalia, Sudan, Syria, US Virgin Islands, Venezuela, Yemen, Zimbabwe, Côte d'Ivoire, Mali, Guinea, Eritrea.
You must be 18 years old or the legal age in your country of residence.
By opening an account, you are considered to have registered of your own volition without solicitation from Milton Markets.
Disclaimer: This website does not constitute investment advice. Content should not be construed as personal advice. Seek independent financial advice.
© 2026 Milton Markets. All rights reserved.
TermsPrivacyCookiesRisk