Milton Markets
Markets
Trading
Company
Partners
Sign InOpen Account
  1. Home/
  2. Market Analysis/
  3. USD/JPY Rises, Reacts to BoJ’s Inflation Outlook but Decline Doesn’t Persist【October 18, 2023】
Koki Ando•Oct 18, 2023

USD/JPY Rises, Reacts to BoJ’s Inflation Outlook but Decline Doesn’t Persist【October 18, 2023】

Koki Ando headshot

Daily Market Analysis

Koki AndoChief Market Analyst

Expert analysis of today's market movements and trading opportunities

Koki Ando headshot

Daily Market Analysis

Koki AndoChief Market Analyst

Expert analysis of today's market movements and trading opportunities

Fundamental Analysis

  • US retail sales show steady results, strengthening dollar purchases and leading to a rise in USD/JPY.
  • Reacting to the report of the Bank of Japan’s upward revision of its inflation outlook, it sharply dropped to the late 148 JPY range.
  • After the sharp decline, it bounced back quickly to the late 149 JPY range.

USDJPY Technical Analysis

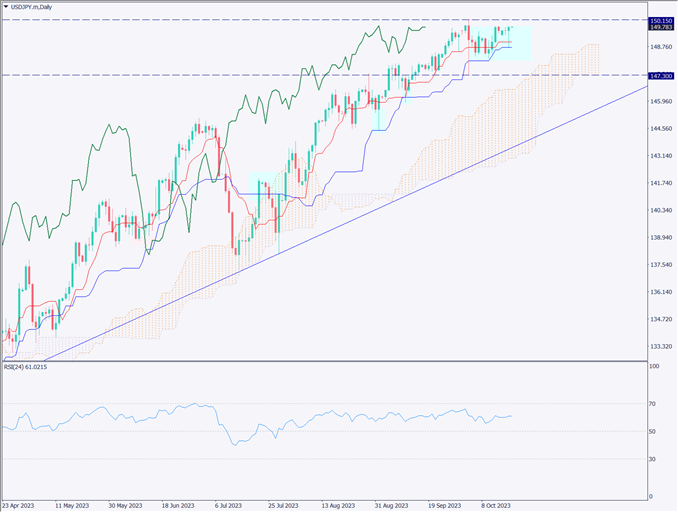
Analyzing the daily chart of the USD/JPY exchange rate. After the report of the BoJ’s inflation outlook revision, it sharply declined, but the standard line of the daily Ichimoku Kinko Hyo chart is acting as a support line. Currently, it’s hovering around the 149.70 JPY range, with low volatility and a lack of directional momentum.

The market reacted sensitively to the BoJ’s inflation outlook revision, dropping to the late 148 JPY range in a short time. However, with no major changes in fundamentals, it was seen as a buying opportunity on dips and quickly recovered to the late 149 JPY range. The solid US economic indicators also support the strength of the dollar.

[USDJPY / D1]

Day Trading Strategy (Hourly)

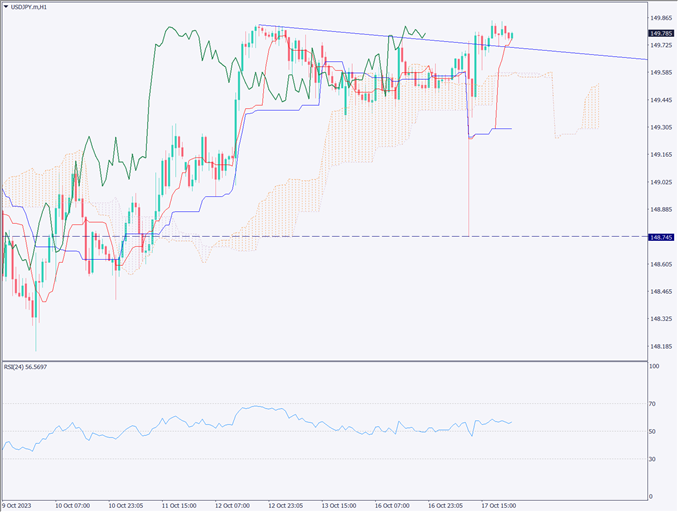
Analyzing the 1-hour chart of the USD/JPY exchange rate. The market sentiment is 75% bearish, and there is a need to consider the possibility of a sharp rise targeting stop-loss orders. The recent significant level is 150.15 JPY, and if it surpasses this, the next benchmarks seem to be 150.60 JPY and then 151.90 JPY. The market is moving cautiously, and it would be best to wait until a clear direction is established.

On the technical side, the RSI isn’t indicating a clear direction, and the turning line of the Ichimoku Kinko Hyo chart is functioning as a support line. As long as it remains above this turning line, the upward momentum is likely to continue. However, entering around the 150 JPY range might be challenging, and contrarian short-term trading might be more suitable.

The day trading policy is to consider a bounce sale, with an entry at 150.30 JPY, settlement at 149.75 JPY, and a stop at 150.50 JPY.

Support and Resistance Lines

The resistance line to be considered in the future is as follows

150.15 JPY – Rough upper limit
148.73 JPY – Daily Ichimoku Kinko Hyo standard line

[USDJPY/ H1]

Market Sentiment

USDJPY Sell: 75% Buy: 25%

Today’s Important Economic Indicators

Economic Indicators and EventsJST (Japan Standard Time)
UK Consumer Price Index15:00
EU Zone Consumer Price Index18:00
US Building Permits21:30

*Trading advice in this article is not provided by Milton Markets, but by Shu Fujiyasu Jr., a certified technical analyst.

Ready to trade?

Open live account

Related Analysis

Gold Remains in a Downtrend, $5,000 Acts as Strong Resistance

Gold Remains in a Downtrend, $5,000 Acts as Strong Resistance

TodayRead more →
USD/JPY Forms a Range — What’s Next?

USD/JPY Forms a Range — What’s Next?

1 day agoRead more →
USD/JPY dips slightly on LDP landslide victory

USD/JPY dips slightly on LDP landslide victory

8 days agoRead more →

This material is for informational purposes only and does not constitute investment advice. Trading leveraged products involves significant risk of loss. Past performance is not indicative of future results.

Share

X

Start trading today

  • Fast execution
  • Competitive spreads
  • 24/7 support
Open live accountView account types
Milton Markets
Twitter/XYouTube

Markets

FOREX
CRYPTO
COMMODITIES
INDICES
STOCKS

Trading

  • Flex Account
  • Smart Account
  • Elite Account
  • MetaTrader 5 (MT5)
  • MetaTrader 4 (MT4)
  • Launch WebTrader
  • Learn Hub
  • Economic Calendar
  • Promotions

Company

  • About Us
  • NDD Technology
  • Customer Protection
  • Execution Conditions
  • Company News
  • Blog
  • Market Analysis

Partners

  • IB Program
  • PAMM Program
  • White Label
  • Investor Login
  • Manager Login

Support

  • Terms of Service
  • Privacy Policy
  • Risk Disclosure
  • Contact Us
  • Help Center
  • My Page Login
Milton Markets is a trading name of Milton Markets Ltd. Milton Markets Ltd. is part of Milton Global and is registered in Saint Lucia (Registration Number: 2023-00166). As part of Milton Global, we adhere to the same high regulatory standards as Milton Global Ltd, which is regulated by the Seychelles Financial Services Authority (FSA) under license SD040.
Risk Warning: CFD trading carries high risk and may not suit all investors. You may lose more than your initial investment. Ensure you understand the risks before trading.
Restrictions: Milton Markets does not provide services to the following countries (not limited to these): United States, Canada, European Union countries, Iran, North Korea, Saint Vincent and the Grenadines, Afghanistan, American Samoa, Belarus, Russia, Burundi, Central African Republic, Congo (Brazzaville), Cuba, Iraq, Lebanon, Liberia, Libya, Myanmar, Puerto Rico, Rwanda, Somalia, Sudan, Syria, US Virgin Islands, Venezuela, Yemen, Zimbabwe, Côte d'Ivoire, Mali, Guinea, Eritrea.
You must be 18 years old or the legal age in your country of residence.
By opening an account, you are considered to have registered of your own volition without solicitation from Milton Markets.
Disclaimer: This website does not constitute investment advice. Content should not be construed as personal advice. Seek independent financial advice.
© 2026 Milton Markets. All rights reserved.
TermsPrivacyCookiesRisk