Milton Markets
Markets
Trading
Company
Partners
Sign InOpen Account
  1. Home/
  2. Market Analysis/
  3. Gold Targets USD 2,000 as Capital Outflows to Safe-Haven Assets Accelerate【October 23, 2023】
Koki Ando•Oct 23, 2023

Gold Targets USD 2,000 as Capital Outflows to Safe-Haven Assets Accelerate【October 23, 2023】

Koki Ando headshot

Daily Market Analysis

Koki AndoChief Market Analyst

Expert analysis of today's market movements and trading opportunities

Koki Ando headshot

Daily Market Analysis

Koki AndoChief Market Analyst

Expert analysis of today's market movements and trading opportunities

Fundamental Analysis

  • Gold momentarily approaches USD 2,000 with no clear end to the Middle East conflict in sight.
  • The possibility of the US getting embroiled in the Middle East conflict increases the demand for safe-haven assets.
  • As the week commences, the market shows a drop with an opening gap; caution is advised during this adjustment period.

XAUUSD Technical Analysis

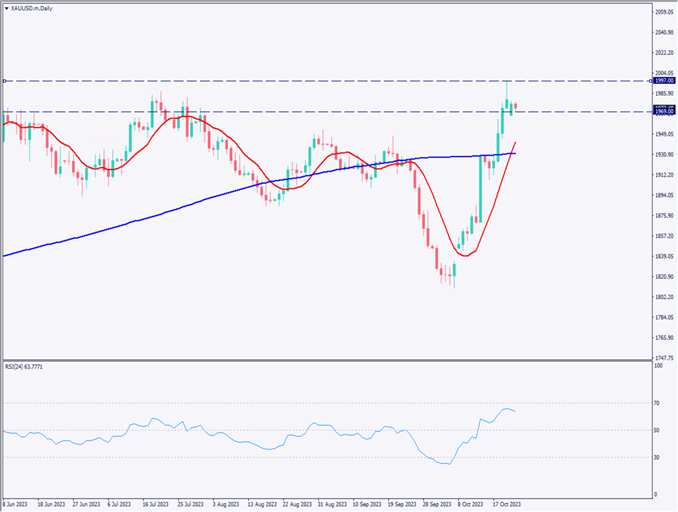
Analyzing the daily gold chart, the 10-day moving average is surpassing the 240-day moving average, indicating the formation of a golden cross. With the price reaching close to the target of USD 2,000, there’s a sense of market cooling down.

The market has experienced a strong rally, making it ripe for a potential correction. For the price to continue its ascent beyond the USD 2,000 mark, fresh catalysts are necessary. Observing the 4-hour RSI, there’s a chance it might dip below 70, signaling the need for caution against a possible medium-term adjustment.

[XAUUSD / D1]

Day Trading Strategy (Hourly)

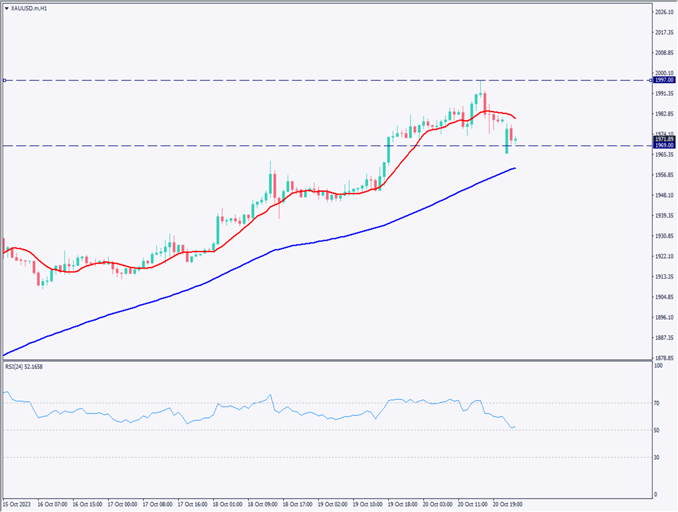
Analyzing the 1-hour chart, the 72-day moving average seems to be serving as a potential support line. The 24-day moving average has been breached, suggesting a possible intensification in the corrective movement. The RSI stands at 52, with the focal point being whether it will bounce at 50 or break below it.

Predicting the trajectory of the Middle East situation is challenging, but an immediate resolution seems unlikely. Fundamentally, it seems natural for gold prices to ascend.

After the sell-offs during corrections, there’s a high likelihood of dip-buying. For day trading, the strategy would be to buy on these dips. Specifically, consider entering around USD 1,960 and targeting exits around USD 1,977. For medium to long-term perspectives, holding up to USD 2,000 is feasible. A stop would ideally be executed once the 72-day moving average is breached.

Support and Resistance Lines

The resistance line to be considered in the future is as follows

USD 2,000 – A round number.
USD 1,969 – A major support line.

[XAUUSD/ H1]

Market Sentiment

XAUUSD Sell: 67% Buy: 33%

Today’s Important Economic Indicators

Economic Indicators and EventsJST (Japan Standard Time)
EU Consumer Confidence Index23:00

*Trading advice in this article is not provided by Milton Markets, but by Shu Fujiyasu Jr., a certified technical analyst.

Ready to trade?

Open live account

Related Analysis

USD/JPY dips slightly on LDP landslide victory

USD/JPY dips slightly on LDP landslide victory

8 days agoRead more →
USD/JPY: Selling Pressure Dominates on Rallies

USD/JPY: Selling Pressure Dominates on Rallies

7 days agoRead more →
Gold and Silver Continue to Hit Record Highs

Gold and Silver Continue to Hit Record Highs

20 days agoRead more →

This material is for informational purposes only and does not constitute investment advice. Trading leveraged products involves significant risk of loss. Past performance is not indicative of future results.

Share

X

Start trading today

  • Fast execution
  • Competitive spreads
  • 24/7 support
Open live accountView account types
Milton Markets
Twitter/XYouTube

Markets

FOREX
CRYPTO
COMMODITIES
INDICES
STOCKS

Trading

  • Flex Account
  • Smart Account
  • Elite Account
  • MetaTrader 5 (MT5)
  • MetaTrader 4 (MT4)
  • Launch WebTrader
  • Learn Hub
  • Economic Calendar
  • Promotions

Company

  • About Us
  • NDD Technology
  • Customer Protection
  • Execution Conditions
  • Company News
  • Blog
  • Market Analysis

Partners

  • IB Program
  • PAMM Program
  • White Label
  • Investor Login
  • Manager Login

Support

  • Terms of Service
  • Privacy Policy
  • Risk Disclosure
  • Contact Us
  • Help Center
  • My Page Login
Milton Markets is a trading name of Milton Markets Ltd. Milton Markets Ltd. is part of Milton Global and is registered in Saint Lucia (Registration Number: 2023-00166). As part of Milton Global, we adhere to the same high regulatory standards as Milton Global Ltd, which is regulated by the Seychelles Financial Services Authority (FSA) under license SD040.
Risk Warning: CFD trading carries high risk and may not suit all investors. You may lose more than your initial investment. Ensure you understand the risks before trading.
Restrictions: Milton Markets does not provide services to the following countries (not limited to these): United States, Canada, European Union countries, Iran, North Korea, Saint Vincent and the Grenadines, Afghanistan, American Samoa, Belarus, Russia, Burundi, Central African Republic, Congo (Brazzaville), Cuba, Iraq, Lebanon, Liberia, Libya, Myanmar, Puerto Rico, Rwanda, Somalia, Sudan, Syria, US Virgin Islands, Venezuela, Yemen, Zimbabwe, Côte d'Ivoire, Mali, Guinea, Eritrea.
You must be 18 years old or the legal age in your country of residence.
By opening an account, you are considered to have registered of your own volition without solicitation from Milton Markets.
Disclaimer: This website does not constitute investment advice. Content should not be construed as personal advice. Seek independent financial advice.
© 2026 Milton Markets. All rights reserved.
TermsPrivacyCookiesRisk