Milton Markets
Markets
Trading
Company
Partners
Sign InOpen Account
  1. Home/
  2. Market Analysis/
  3. Gold Rises, U.S. Consumer Price Index Falls Short of Market Expectations【November 15, 2023】
Koki Ando•Nov 15, 2023

Gold Rises, U.S. Consumer Price Index Falls Short of Market Expectations【November 15, 2023】

Koki Ando headshot

Daily Market Analysis

Koki AndoChief Market Analyst

Expert analysis of today's market movements and trading opportunities

Koki Ando headshot

Daily Market Analysis

Koki AndoChief Market Analyst

Expert analysis of today's market movements and trading opportunities

Fundamental Analysis

  • U.S. Consumer Price Index Falls Short of Market Expectations, Strengthening Views of End to Rate Hike Cycle
  • Expectations for U.S. Rate Cuts in the Coming Year, U.S. Stock Prices Surge & Dollar Selling Intensifies
  • Gold Soars on Lower Interest Rate Expectations, Rebounds at 240MA

XAUUSD Technical Analysis

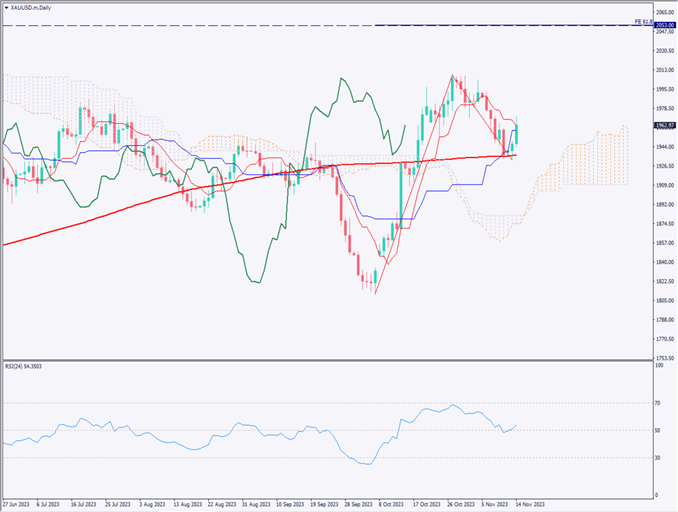
Analyzing the daily chart of the gold market. With the U.S. Consumer Price Index falling short of market expectations, the market anticipates an end to the rate hike cycle and rate cuts next year. As a result, U.S. stock indices have risen significantly, and with expected interest rate decreases, gold is attracting buyers.

Gold has rebounded at the 240-day moving average, with the conversion line of the Ichimoku Kinko Hyo acting as a resistance line. Based on Fibonacci expansion, the final target price on the upside is USD 2052.

On the other hand, the near-term upside target is expected to be USD 1985. As long as the market’s expectation of lower interest rates continues, the uptrend in gold is likely to persist.

[XAUUSD/ D1]

Day Trading Strategy (1-Hour Chart)

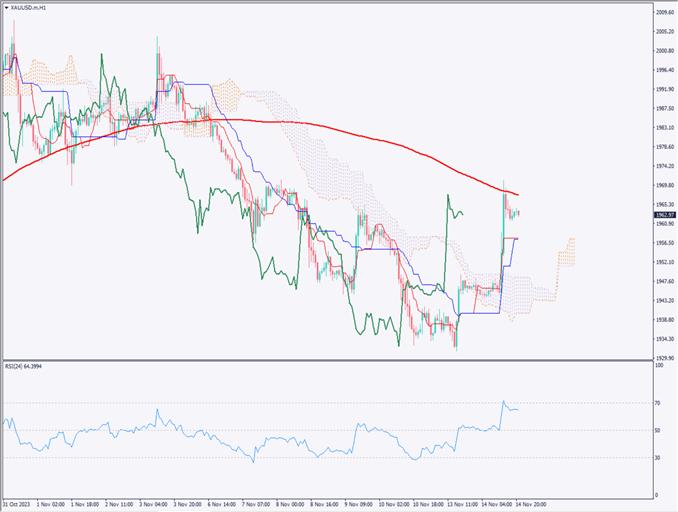
Analyzing the 1-hour chart of the gold market. The 240 moving average is showing a significant downward curve, and the current price has reached this moving average, showing signs of a rebound.

If the mood for rate cuts continues, gold will be fundamentally supported, but the focus will be on whether it can surpass the 240MA. With the RSI reaching around 70, there is a possibility of a certain degree of downward adjustment.

As a day trading strategy, consider buying on dips at USD 1950, setting the take profit at USD 1975, and stop loss at USD 1940.

Support and Resistance Lines

The resistance line to be considered in the future is as follows

2052 USD – Major Resistance Line
1985 USD – Near-term Major Resistance Line

[XAUUSD/ H1]

Market Sentiment

XAUUSD Sell: 65% Buy: 35%

Today’s Important Economic Indicators

Economic Indicators and EventsJST (Japan Standard Time)
Japanese GDP8:50
UK Consumer Price Index (Forecast 4.8%)16:00
U.S. Core Retail Sales22:30
U.S. Producer Price Index22:30
U.S. Crude Oil Inventory0:30 (Next Day)

*Trading advice in this article is not provided by Milton Markets, but by Shu Fujiyasu Jr., a certified technical analyst.

Ready to trade?

Open live account

Related Analysis

USD/JPY dips slightly on LDP landslide victory

USD/JPY dips slightly on LDP landslide victory

8 days agoRead more →
USD/JPY Forms a Range — What’s Next?

USD/JPY Forms a Range — What’s Next?

1 day agoRead more →
Can Gold Renew Its Record High?

Can Gold Renew Its Record High?

11 days agoRead more →

This material is for informational purposes only and does not constitute investment advice. Trading leveraged products involves significant risk of loss. Past performance is not indicative of future results.

Share

X

Start trading today

  • Fast execution
  • Competitive spreads
  • 24/7 support
Open live accountView account types
Milton Markets
Twitter/XYouTube

Markets

FOREX
CRYPTO
COMMODITIES
INDICES
STOCKS

Trading

  • Flex Account
  • Smart Account
  • Elite Account
  • MetaTrader 5 (MT5)
  • MetaTrader 4 (MT4)
  • Launch WebTrader
  • Learn Hub
  • Economic Calendar
  • Promotions

Company

  • About Us
  • NDD Technology
  • Customer Protection
  • Execution Conditions
  • Company News
  • Blog
  • Market Analysis

Partners

  • IB Program
  • PAMM Program
  • White Label
  • Investor Login
  • Manager Login

Support

  • Terms of Service
  • Privacy Policy
  • Risk Disclosure
  • Contact Us
  • Help Center
  • My Page Login
Milton Markets is a trading name of Milton Markets Ltd. Milton Markets Ltd. is part of Milton Global and is registered in Saint Lucia (Registration Number: 2023-00166). As part of Milton Global, we adhere to the same high regulatory standards as Milton Global Ltd, which is regulated by the Seychelles Financial Services Authority (FSA) under license SD040.
Risk Warning: CFD trading carries high risk and may not suit all investors. You may lose more than your initial investment. Ensure you understand the risks before trading.
Restrictions: Milton Markets does not provide services to the following countries (not limited to these): United States, Canada, European Union countries, Iran, North Korea, Saint Vincent and the Grenadines, Afghanistan, American Samoa, Belarus, Russia, Burundi, Central African Republic, Congo (Brazzaville), Cuba, Iraq, Lebanon, Liberia, Libya, Myanmar, Puerto Rico, Rwanda, Somalia, Sudan, Syria, US Virgin Islands, Venezuela, Yemen, Zimbabwe, Côte d'Ivoire, Mali, Guinea, Eritrea.
You must be 18 years old or the legal age in your country of residence.
By opening an account, you are considered to have registered of your own volition without solicitation from Milton Markets.
Disclaimer: This website does not constitute investment advice. Content should not be construed as personal advice. Seek independent financial advice.
© 2026 Milton Markets. All rights reserved.
TermsPrivacyCookiesRisk