Milton Markets
Markets
Trading
Company
Partners
Sign InOpen Account
  1. Home/
  2. Market Analysis/
  3. USD/JPY Falls as U.S. Labor Market Shrinks, Raising Speculation of an End to Interest Rate Hikes【November 17, 2023】
Koki Ando•Nov 17, 2023•Updated: Nov 20, 2023

USD/JPY Falls as U.S. Labor Market Shrinks, Raising Speculation of an End to Interest Rate Hikes【November 17, 2023】

Koki Ando headshot

Daily Market Analysis

Koki AndoChief Market Analyst

Expert analysis of today's market movements and trading opportunities

Koki Ando headshot

Daily Market Analysis

Koki AndoChief Market Analyst

Expert analysis of today's market movements and trading opportunities

Fundamental Analysis

  • The U.S.-China summit concludes, agreement on military-level dialogue but no resolution to conflicts
  • U.S. unemployment insurance claims increase, indicating a slight contraction in the labor market
  • Crude oil prices drop significantly, breaking the USD 75 support line, falling into the USD 72 range

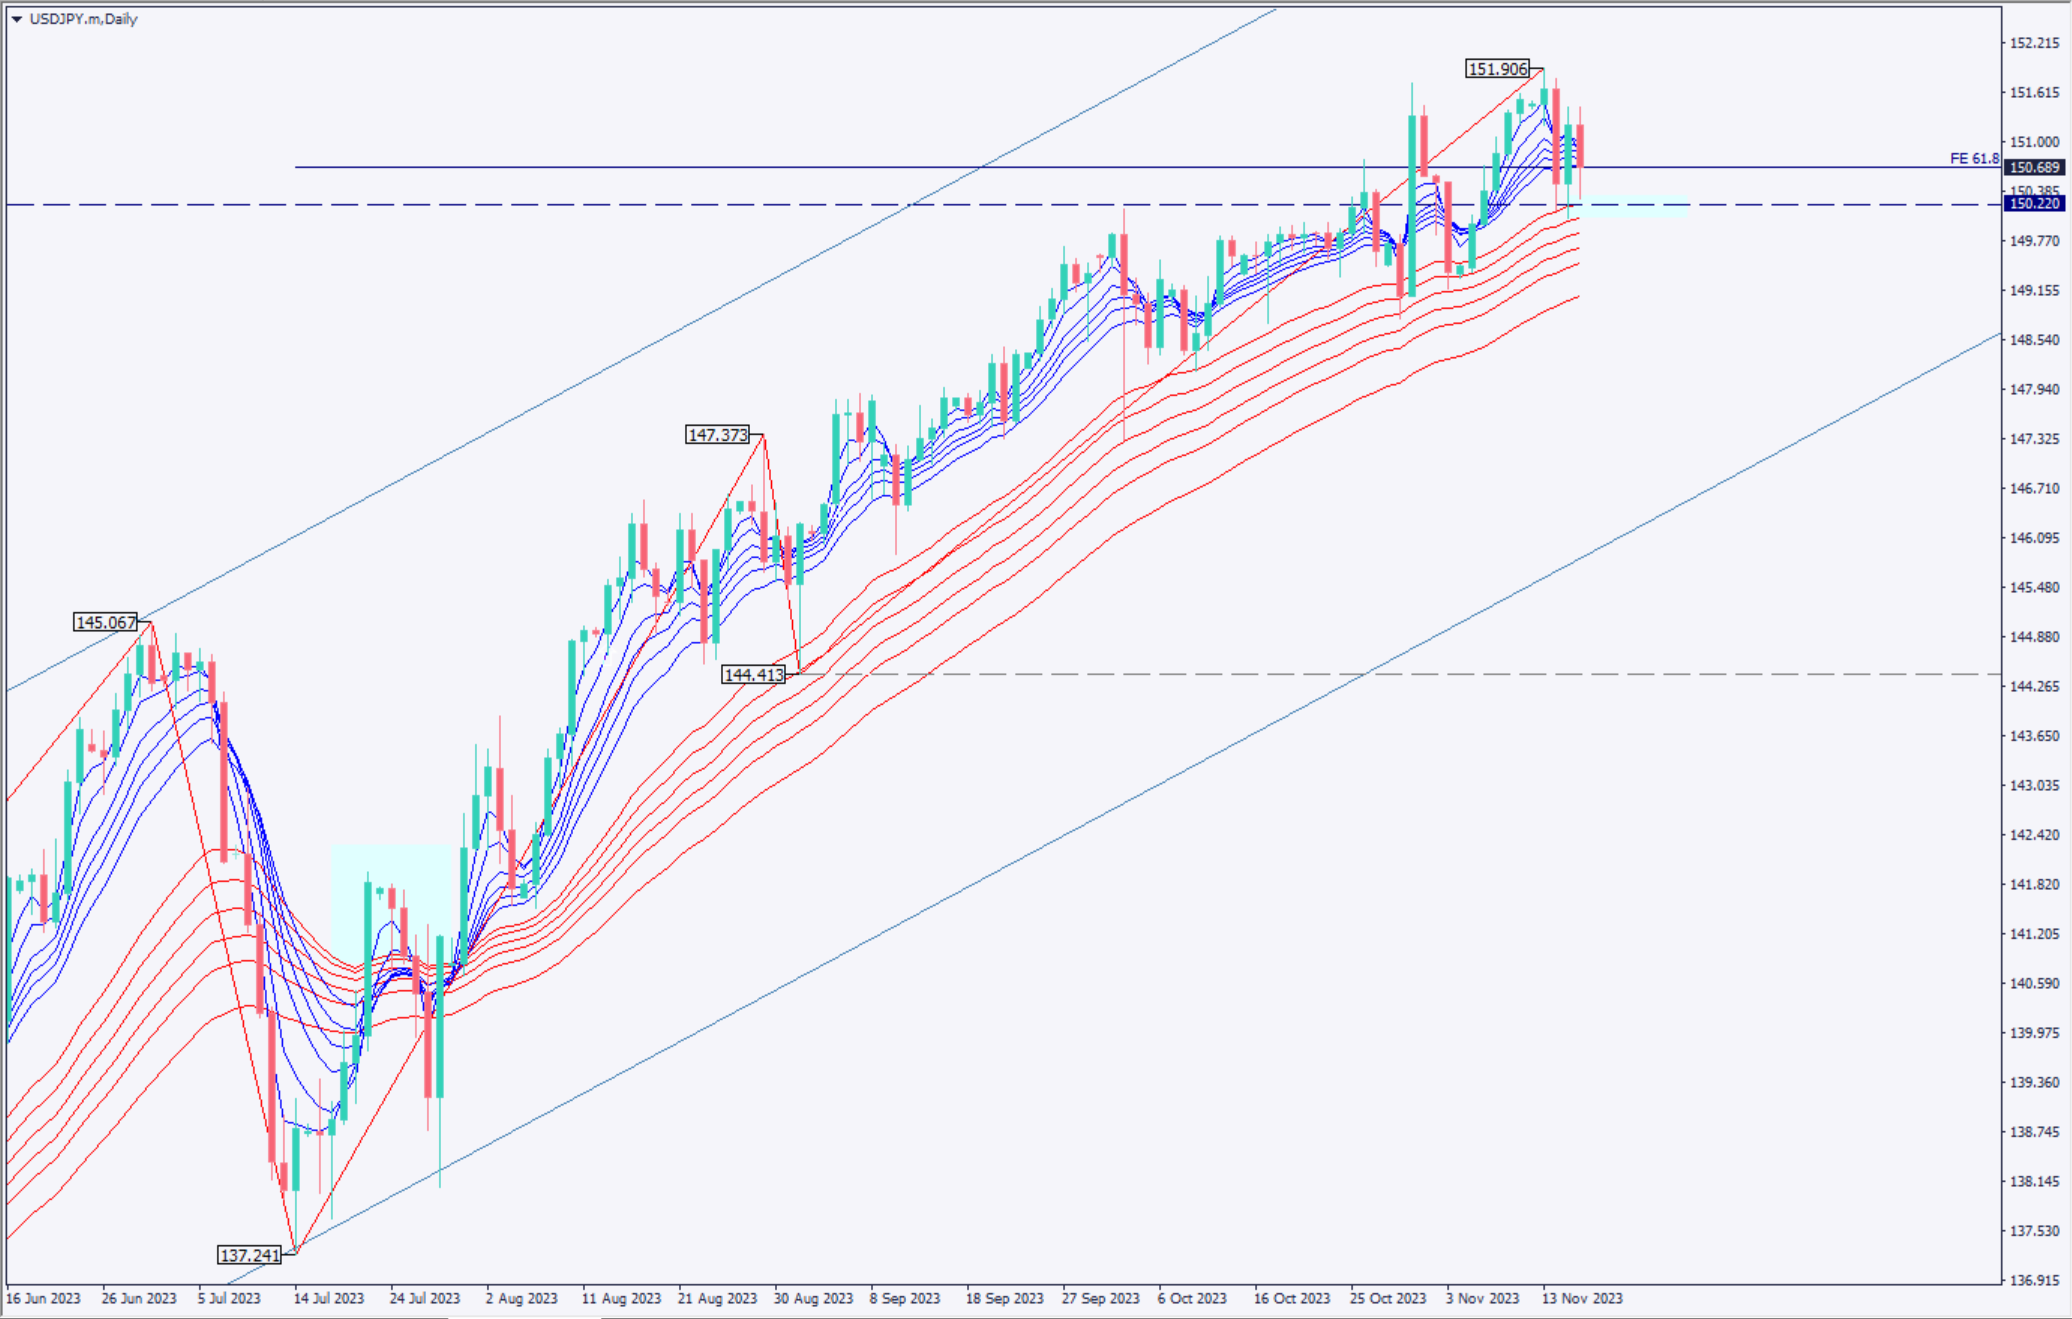
USDJPY Technical Analysis

Analyzing the daily chart of the USD/JPY pair. Currently, the price has fallen to the mid-150 JPY range, reflecting the increase in job seekers due to the rise in U.S. unemployment insurance claims. This has lowered the likelihood of further interest rate hikes, leading to a rise in stock prices and a cheaper dollar.

The market is currently enveloped by the high and low of a large bearish candle formed three days ago, requiring caution for strong future movements. A drop below 150.22 JPY could accelerate the yen’s strength. The Ichimoku Kinko Hyo suggests a potential market peak, with prices below the Conversion Line. The expected U.S. interest rate cut could lead to a narrowing interest rate differential, potentially strengthening the yen.

[USDJPY/ D1]

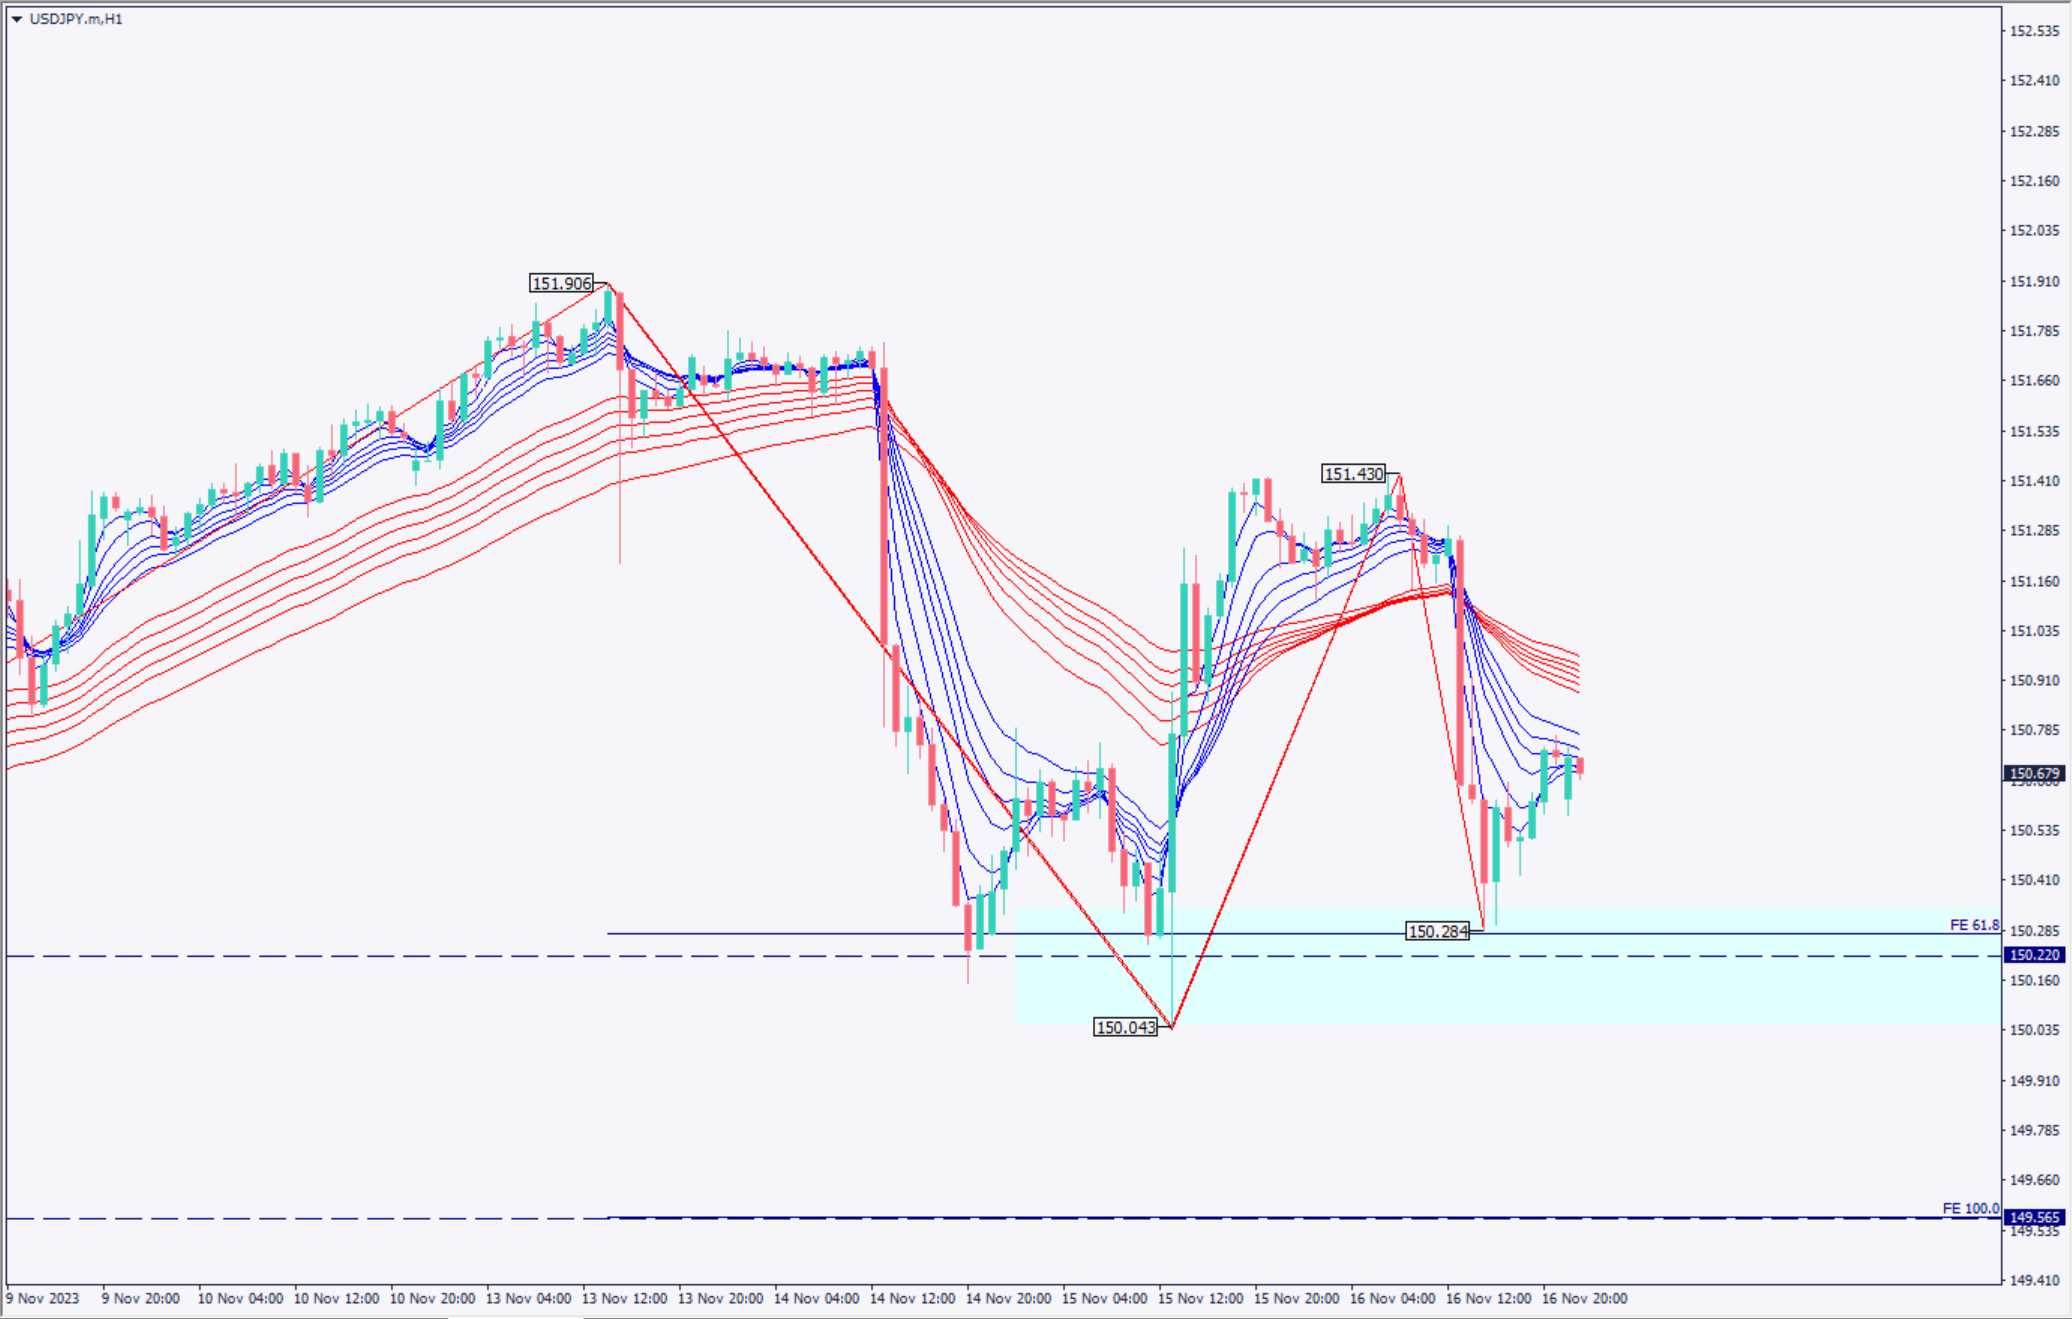
Day Trading Strategy (1-Hour Chart)

Analyzing the 1-hour chart of the USD/JPY pair. Currently, a strong downward trend is visible, aiming towards 150.220 JPY. Today’s pivot point is around 150.80 JPY, with a strong resistance above 150.75 JPY.

The RSI stands at 45, and the MACD histogram is beginning to form a valley. Yesterday’s low was 150.285 JPY, which did not break below 150.220 JPY. Considering the daily chart pattern, there is a possibility of retesting the low.

For day trading, consider selling on a rebound near 150.75 JPY. Set the take-profit at 150.22 JPY and the stop-loss at 151.20 JPY.

Support and Resistance Lines

The resistance line to be considered in the future is as follows

151.48 JPY: Major resistance zone
150.22 JPY: Major support zone

[USDJPY/ H1]

Market Sentiment

USDJPY: 66% Sell, 33% Buy

Today’s Important Economic Indicators

Economic Indicators and EventsJST (Japan Standard Time)
UK Retail Sales16:00
EU Consumer Price Index19:00
U.S. Building Permits22:30

*Trading advice in this article is not provided by Milton Markets, but by Shu Fujiyasu Jr., a certified technical analyst.

Ready to trade?

Open live account

Related Analysis

Gold Remains in a Downtrend, $5,000 Acts as Strong Resistance

Gold Remains in a Downtrend, $5,000 Acts as Strong Resistance

TodayRead more →
USD/JPY Forms a Range — What’s Next?

USD/JPY Forms a Range — What’s Next?

1 day agoRead more →
USD/JPY: Selling Pressure Dominates on Rallies

USD/JPY: Selling Pressure Dominates on Rallies

7 days agoRead more →

This material is for informational purposes only and does not constitute investment advice. Trading leveraged products involves significant risk of loss. Past performance is not indicative of future results.

Share

X

Start trading today

  • Fast execution
  • Competitive spreads
  • 24/7 support
Open live accountView account types
Milton Markets
Twitter/XYouTube

Markets

FOREX
CRYPTO
COMMODITIES
INDICES
STOCKS

Trading

  • Flex Account
  • Smart Account
  • Elite Account
  • MetaTrader 5 (MT5)
  • MetaTrader 4 (MT4)
  • Launch WebTrader
  • Learn Hub
  • Economic Calendar
  • Promotions

Company

  • About Us
  • NDD Technology
  • Customer Protection
  • Execution Conditions
  • Company News
  • Blog
  • Market Analysis

Partners

  • IB Program
  • PAMM Program
  • White Label
  • Investor Login
  • Manager Login

Support

  • Terms of Service
  • Privacy Policy
  • Risk Disclosure
  • Contact Us
  • Help Center
  • My Page Login
Milton Markets is a trading name of Milton Markets Ltd. Milton Markets Ltd. is part of Milton Global and is registered in Saint Lucia (Registration Number: 2023-00166). As part of Milton Global, we adhere to the same high regulatory standards as Milton Global Ltd, which is regulated by the Seychelles Financial Services Authority (FSA) under license SD040.
Risk Warning: CFD trading carries high risk and may not suit all investors. You may lose more than your initial investment. Ensure you understand the risks before trading.
Restrictions: Milton Markets does not provide services to the following countries (not limited to these): United States, Canada, European Union countries, Iran, North Korea, Saint Vincent and the Grenadines, Afghanistan, American Samoa, Belarus, Russia, Burundi, Central African Republic, Congo (Brazzaville), Cuba, Iraq, Lebanon, Liberia, Libya, Myanmar, Puerto Rico, Rwanda, Somalia, Sudan, Syria, US Virgin Islands, Venezuela, Yemen, Zimbabwe, Côte d'Ivoire, Mali, Guinea, Eritrea.
You must be 18 years old or the legal age in your country of residence.
By opening an account, you are considered to have registered of your own volition without solicitation from Milton Markets.
Disclaimer: This website does not constitute investment advice. Content should not be construed as personal advice. Seek independent financial advice.
© 2026 Milton Markets. All rights reserved.
TermsPrivacyCookiesRisk